
The tissue images and MS data presented in this document were provided courtesy of David Rizzo at Vanderbilt University in Nashville, TN, USA.
Application & Background
When depositing MALDI matrix onto tissue samples for subsequent Imaging Mass Spectrometry (IMS), the selec-tion of an appropriate sample preparation technique is key to obtaining maximum signal intensity and image resolu-tion. The principle of MALDI IMS requires the co-localiza-tion of an ionization promoter (matrix) with the molecular species of interest(1). The introduction of the matrix can be performed in a number of ways including spotting, spraying or sublimating onto the tissue surface(2-5).
Here we demonstrate how the adjustment of spraying conditions on the HTX TM-Sprayer enables the maximiza-tion of signal intensity for specific molecular species while limiting delocalization of these same species. The process optimization approach also provides a guideline for the MS imaging optimization of other molecular species.
n this example, the user was interested in imaging a wide molecular weight range of proteins (3-30 kDa) in a rat kidney tissue section. Previous studies have suggested that a wetter matrix deposition process (slower drying time) increases extraction of these species towards the surface of the tissue, promoting co-crystallization with the matrix and improving MS signal intensity. However, the laws of chemical diffusion also suggest that allowing the tissue surface to remain wet for a long duration will provide an opportunity for molecules to re-organize spatially to achieve a lower system entropy.
Chemical diffusion, which results in the delocalization of chemical species, works against our goal to image analytes in their original location in the tissue sample and we should seek to limit it during sample preparation.
Experimental
Experimental plan
The HTX TM-Sprayer provides the ability to control spray temperature (T) and nozzle lateral velocity (V) during the sample preparation. Because both parameters affect the matrix solution evaporation rate and can be adjusted inde-pendently from one another the user has the opportunity to optimize signal intensity while reducing delocalization. In this experiment we varied temperatures (T) from 75 to 105°C (10°C increments) and velocity (V) from 700 to 1,300 mm/min (200 mm/min increments). For profiling experi-ments, average spectra were collected over 5,000 shots. For imaging experiments, complete ion images were produced for each of 16 samples.
Sample Preparation
Fresh frozen rat kidney was sectioned at 12 microns on a cryomicrotome and thaw-mounted on indium tin oxide (ITO) coated slides. Tissues were allowed to air dry for 30 minutes prior to washing. Slides were washed to remove salts and lipids in 70% EtOH (30 sec), 100% EtOH (30 sec), Carnoy’s Solution - 6:3:1 EtOH:chloroform:acetic acid (2 min), 100% EtOH (30 sec), ddH2O (30 sec), 100% EtOH (30 sec) as previously described(5) and then allowed to air dry.
Matrix Deposition
Sinapinic acid was applied to the slides at a concentration of 5 mg/mL using the TM-Sprayer. The slides were coated using the instrument parameters listed in Table 1.
Rehydration/recrystallization
Once the slides were coated with matrix, a rehydration step was performed as described previously(5). Briefly, a 9% acetic acid solution was used as the rehydration solution. Slides were allowed to air dry for 5 minutes prior to further analysis.
MALDI Mass Spectrometry Imaging
Spectra from m/z 3,000 to 30,000 were collected across the entire tissue area using an Autoflex Speed MALDI-TOF mass spectrometer (Bruker Daltonics) with a SmartBeam laser operating at 1 kHz in positive ion linear mode. For the imaging acquisition, a total of 200 laser shots were accumulated and averaged from each pixel, using a lateral spatial resolution of 250 µm. Image acquisition and analysis were carried out using FlexImaging 3.0, and spectral analysis was performed with FlexAnalysis 3.3.

Figure 1. Ion intensity differences seen for lower molecular weight species (m/z 4,964) Representative spectra from rat kidney medulla showing signal intensity for the peak at m/z 4964, denoted with the asterisks, increasing from black spectrum (low - 10.8 a.u.) then red spectrum (high - 33.9 a.u.). Inset shows an expanded view of the peak of interest. Intensity axes were scaled to the same values.

Figure 2. Ion intensity differences seen for medium molecular weight species (m/z 8,570) Representative spectra from rat kidney medulla showing signal intensity for the peak at m/z 8570, denoted with the asterisks, increasing from 8.35 x 10² a.u. orange spectrum (low - 12.3 a.u.) to blue spectrum (high - 22.5 a.u.). Inset shows an expanded view of the peak of interest. Intensity axes were scaled to the same values.

Figure 3. Ion intensity differences seen for higher molecular weight species (m/z 21,900) Representative spectra from rat kidney medulla showing signal intensity for the peak at m/z 21900, denoted with the asterisks, increasing from green spectrum (low - 1.2 a.u.) to purple spectrum (high - 1.4 a.u.). Inset shows an expanded view of the peak of interest. Intensity axes were scaled to the same values
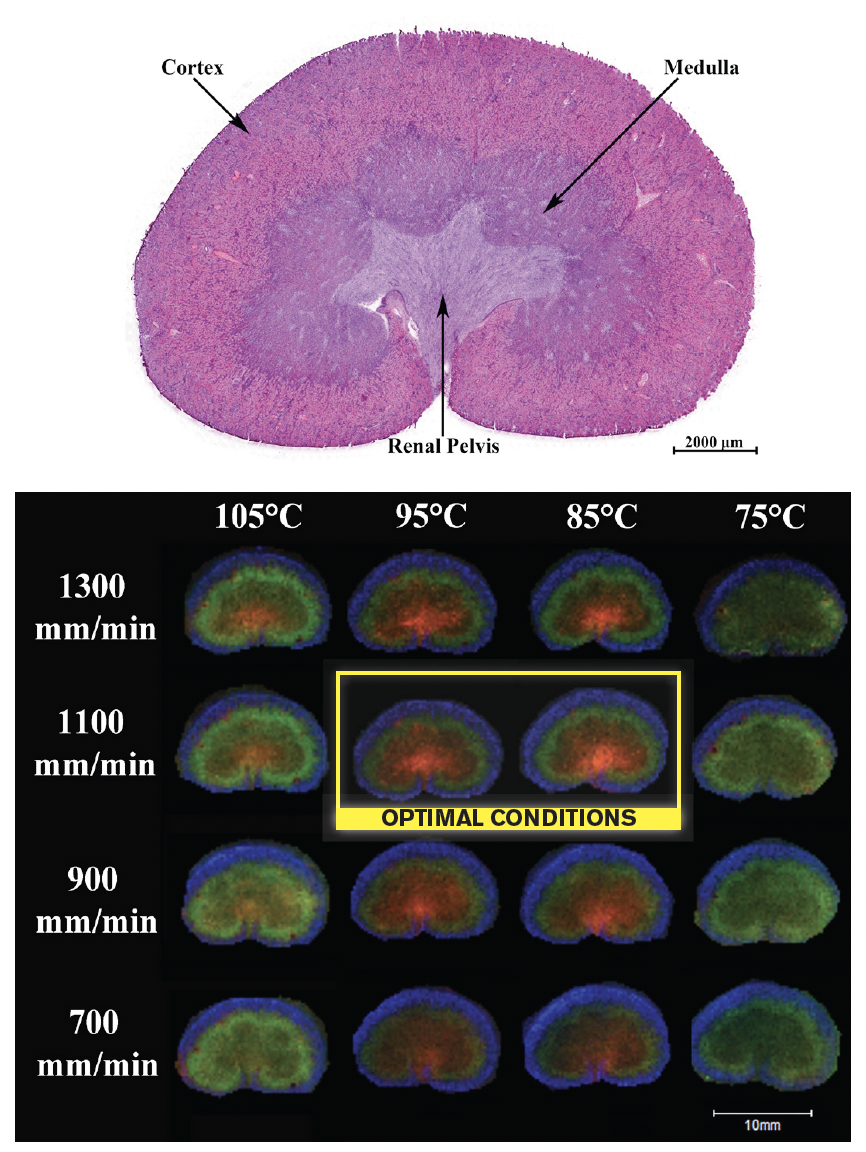
Figure 4. Imaging comparison using rat kidney. Eight passes of SA (5 mg/mL) were applied using the TM Sprayer at varying temperature and velocity settings. (a) H&E stained serial rat kidney section (12 µm-thick). Scale bar represents 2 mm. (b) Composite ion images collected from 12 µm-thick rat kidney sections at 200 µm lateral resolution. Colors correspond to multiple m/z values: 4,748 & 4,964 (red); 6,052 & 6,084 (blue); and 8,570 & 14,218 (green).
Results & cONCLUSIONS
From initial experiments comparing spectra collected in the cortex region, it was found that lower temperatures (75-85°C) and medium velocities (900-1100 mm/min) gave rise to more intense protein signal. These conditions led to relatively wet coatings of the tissue, allowing for better analyte extraction and cocrystallization with the matrix. Alternatively, the higher temperatures and lower velocities gave a much thicker, drier coating with minimal analyte extraction. The imaging experiment took into account peak intensities as well as localization patterns within the tissue.
The conditions previously found to give the most abundant signals had a great deal of delocalization. It was found that the middle temperatures (85-95°C) and the medium velocities (900-1100 mm/min) gave abundant, localized signal over the majority of the mass range. This was due in large part to the optimization of the coating wetness to increase extraction while decreasing delocalization.
It should be noted that this is merely a starting point, and that methods must be optimized for different matrices, solvents, tissue types, and analytes of interest. The versatility of the HTX TM-Sprayer™ for matrix coating allows for more complete method optimization and enhanced imaging capabilities.
references
(1.) Caprioli, R. M.; Farmer, T. B.; Gile, J., Analytical Chemistry 1997, 69 (23), 4751-4760.
(2.) Schwartz, S. A.; Reyzer, M. L.; Caprioli, R. M., Journal of Mass Spectrometry 2003, 38 (7), 699-708.
(3.) Cerruti, C. D.; Touboul, D.; Guérineau, V.; Petit, V. W.; Laprévote, O.; Brunelle, A., Anal Bioanal Chem 2011, 401 (1), 75-87.
(4.) Hankin, J. A.; Barkley, R. M.; Murphy, R. C., Journal of the American Society for Mass Spectrometry 2007, 18 (9), 1646-1652.
(5.) Yang, J.; Caprioli, R. M., Analyti-cal Chemistry 2011, 83 (14), 5728-5734.