
N-Glycan Imaging Kits, including IMS validated PNGase F
PRIME (TM), are available from Glycopath. To order or request
further information please visit www.glycopath.com

Application & Background
N-glycans are one of the most common post-translational modification found on mammalian secreted and membrane proteins. These covalent additions of oligosaccharides to asparagine residues change in response to metabolism and disease, making them strong indicators of pathology. In tissue, specific N-glycan motifs have been correlated with tumor regions, immune infiltrate, and tissue necrosis. MALDI Imaging of N-glycans has allowed for this spatialomic identification of N-glycan signatures to be performed. N-glycan structures are predicted by their biosynthetically-defined make-up, and generally range from 900- 5,000 Da in size.
In order to detect N-glycans via MALDI Imaging, the glycans have to be enzymatically cleaved from their carrier proteins. This is done through spraying an enzyme, PNGaseF, at a low flow rate across tissues using the HTX M3+ Sprayer. A lower flow rate is used to conserve the total amount of enzyme needed, as well as to prevent a thick coating of enzyme that would hinder N-glycan ionization and detection. Following PNGaseF application, slides are incubated for enzymatic cleavage and then returned to the Sprayer for matrix application. Matrix application is done at a higher flow rate, but with the same pump used for enzyme spraying, without any manual modifications to the instrument needed. The automated PumpScripts on the HTX M3+ Sprayer, Figure 1, provide thorough and hands-free cleaning of the Sprayer between enzyme and matrix spray cycles, which is essential for optimal application of these two distinct reagents. An overview of this workflow is shown in Figure 2.

Figure 1. Automated PumpScripts attached to each spray method.

Figure 2. Workflow for N-glycan MALDI MSI analysis on FFPE tissues. Adapted from McDowell et al. (2021) Mass Spec Rev.
Experimental
experimental design
The human tissue sections analyzed in this study were obtained from Richard Drake at the Medical University of South Carolina. Tissues were formalin-fixed paraffin-embedded human prostate or colon sections cut on standard glass slides at 5-10 μm thickness. Tissue sections were let dry in a 37° C oven overnight. Tissues were then stored in mailers under ambient conditions prior to sample preparation for N-glycan imaging.
Tissue Dewaxing and antigen retrieval
Tissue sections were dewaxed and antigen retrieved prior to sample preparation by the HTX M3+ Sprayer. Dewaxing was performed with heat incubation and chemical washes. Slides were placed in a 60°C oven for 1 hour and then let cool to room temperature. Slides were then washed with 100% xylene (3 mins x 2), 100% ethanol (1 min x 2), 95% ethanol (1 min x 2), 70% ethanol (1 min x 2), and water (3 mins x 2). Antigen retrieval was then performed to remove protein crosslinks for better enzyme access. A vegetable steamer or decloaker was heated to 95°C prior to retrieval and then the samples were placed inside slide mailers containing buffer and put into steamer for 25 minutes. Following antigen retrieval, slides were buffer exchanged into HPLC-grade water and let cool. Slides were then placed in a vacuum desiccator until dry and then scanned at 1200 ppi resolution.
Enzyme and Matrix Application using the HTX M3+ Sprayer
Using the HTX M3+ Sprayer, PNGaseF was applied to the slide using the parameters displayed in Table 1. As the enzyme was being sprayed, a humidity chamber was constructed from a plastic cell culture dish with a paper towel and two Kim Wipes saturated with double-distilled water (~3 mL) and placed in a 37°C oven for 15 minutes to preheat. After the enzyme was sprayed on the slide, the slide was removed from the HTX M3+ Sprayer and placed face-up in the humidity chamber. The chamber was left to incubate for 2 hrs i n a 37°C oven. The slide was then removed from the humidity chamber, and the bottom of the slide was dried using a KimWipe. Using the HTX M3+ Sprayer, α-cyano-4- hydroxycinnamic acid (CHCA) matrix was applied to the slide using the parameters displayed in Table 1.
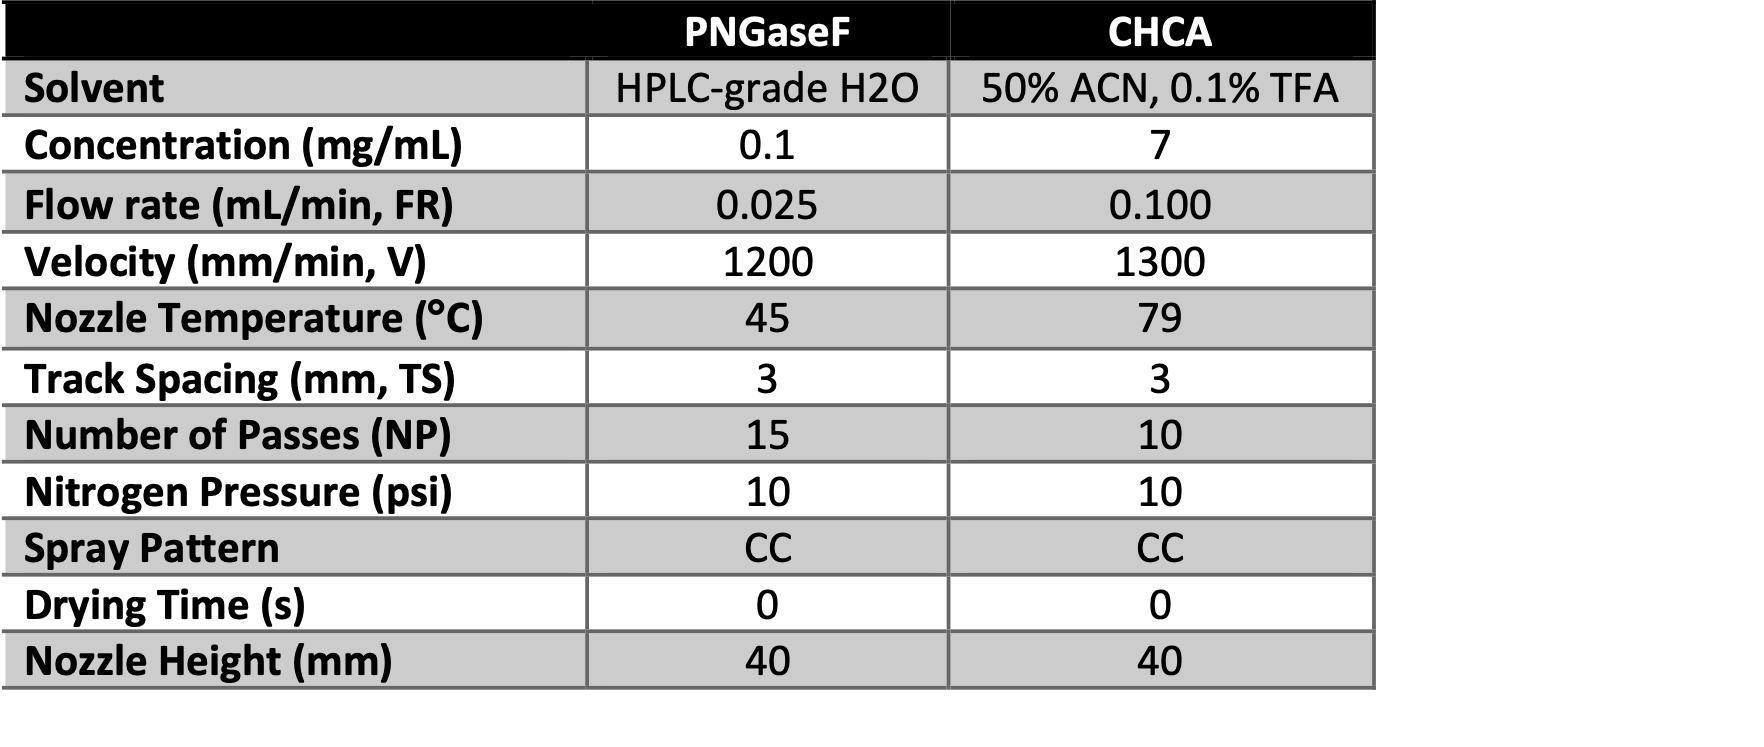
Table 1. Spraying parameters for sequential enzyme and matrix deposition by HTX M3+ Sprayer.
data collection and analysis
Prior to imaging, the slide was scanned at 1200-ppi resolution. All imaging experiments were performed on a timsTOF fleX MALDI mass spectrometer in positive ion mode with a Smart Beam 3D 10kHz laser at laser spot sizes of 10-20 μm (Bruker Daltonics, Billerica, MA, USA). Tims capability was not enabled for these runs. At each pixel, 200 laser shots were collected at a 20-40 μm raster.
The data were collected using flexImaging v5.0 software and normalized to total ion count (Bruker Daltonics, Billerica, MA, USA). The data were imported into the SCiLS Lab software and visualized normalized to total ion count (Bruker Daltoniks, Bremen, Germany). N-glycan peaks were manually selected based on their theoretical known mass values using a mass filter interval to 0.005%.
results
Results from this methodology are images of N-glycan localization across tissues. Overall spectra show detection of many N-glycans simultaneously from this workflow, Figure 3. Each N-glycan m/z are visualized as heatmaps across the slide using SCiLS Lab, Figure 4. Specific N-glycans localized to unique tissue regions can be observed and matched to pathology scans, Figure 5.
N-glycans are broadly categorized into groups based on structural motifs. These motifs differ in the composition and arrangement of individual sugar residues. The variety of residues impact the glycans' biological functions, with residues such as sialic acids imposing a negative charge and fucoses affecting immune signaling. The identification of N-glycan composition by MALDI MS therefore provides important insights into biological processes occurring in various tissue regions.

Figure 3. Example overall spectrum from N-glycan tissue imaging.

Figure 4. Prostate tumor tissue imaged at 40μm. (A) N-glycan localized to stroma surrounding tumor. (B) N-glycan localized to tumor regions.
In the images presented here, specific N-glycan motifs were co-localized to pathologically-relevant areas of tissue. Figure 4 illustrates two fucosylated glycans that vary only in their degree of branching, i.e. the number of antennae present on the N-glycan. The more highly branched glycan with m/z 2539.8541 (4B) is observed primarily in the tumor regions of this prostate tissue section. Highly branched glycans are a commonly found tumor-associated motif, whereas some glycan motifs strongly vary across different cancer and tissue types. For example, a high mannose glycan is observed in the lumen of prostate tissue (Figure 5B), yet another glycan in the high mannose family is found in the tumor region of a colon tissue(Figure6A).These data highlight the diversity of N- glycan structures found in human tissue and the value of profiling cohorts of patient samples.

Figure 5. Prostate tissue imaged at 40μm. (A) Trichrome staining of prostate tissue section. (B) HighmannoseN-glycanlocalizedtothelumenoftheprostatetissue. (C) Sialylated & fucosylated N-glycan localized to the regions of the tissue containing large amounts of collagen. (D) Overlay image of 3 specific N-glycans corresponding to 3 unique regions of the tissue section.
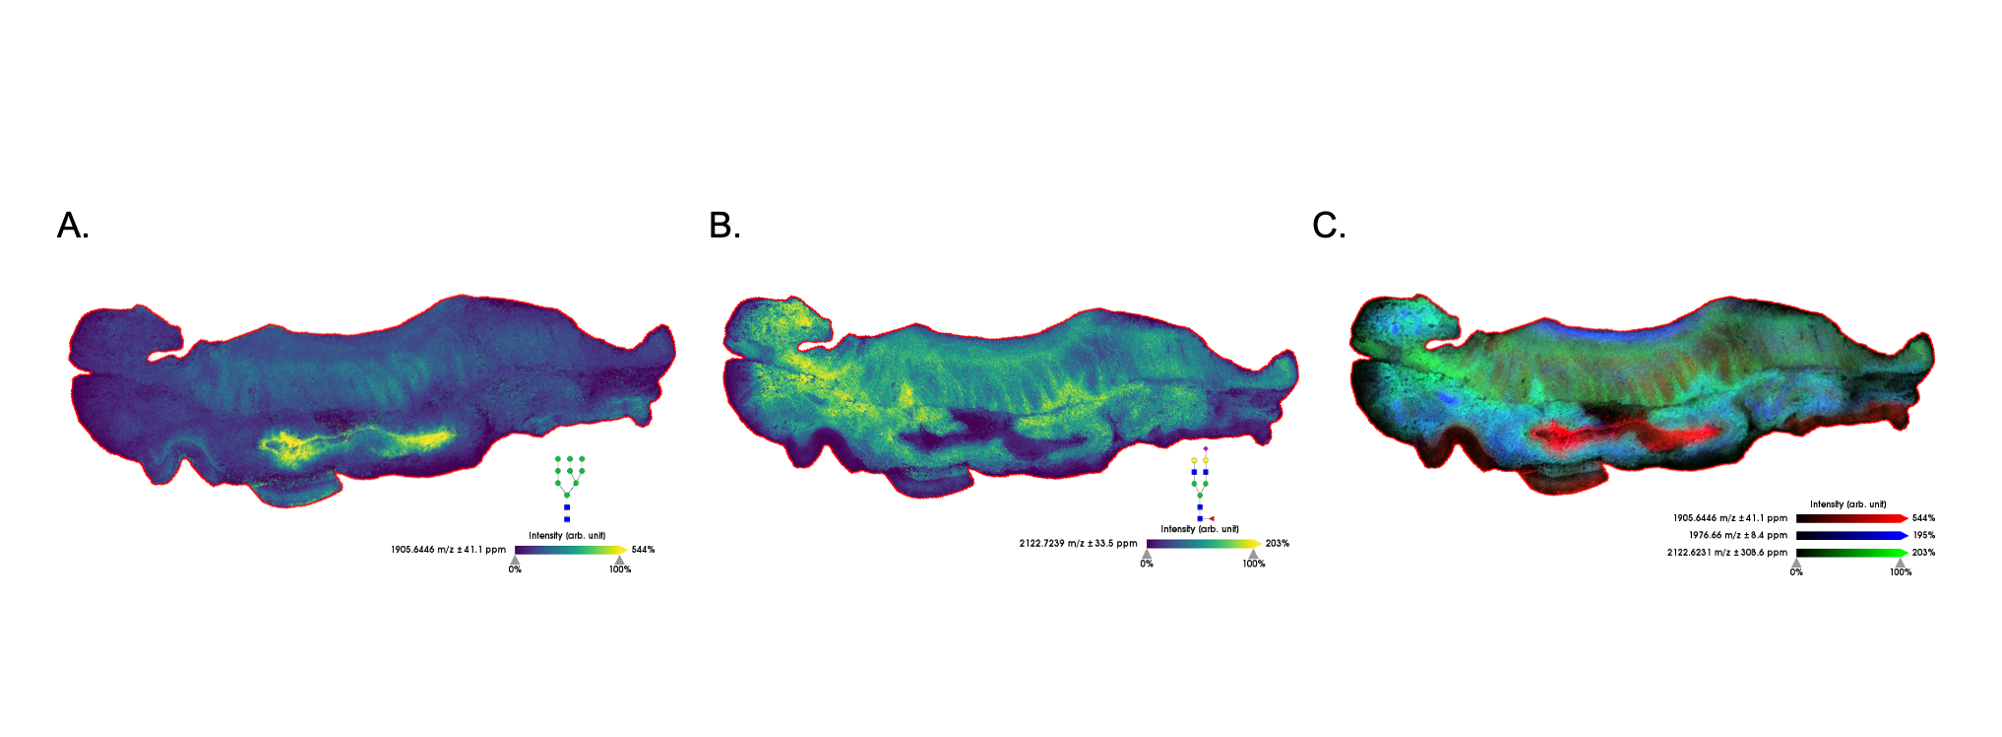
Figure 6. Colon tumor tissue imaged at 20μm. (A) High mannose glycan localized to tumor region. (B) Sialylated & fucosylated glycan localized to surrounding smooth muscle tissue and crypts. (C) Overlay of 3 specific N-glycans corresponding to unique regions of the tissue.
Conclusions
We demonstrate the use of the HTX M3+ Sprayer for N-glycan release and matrix coating on FFPE tissues for MALDI imaging. FFPE tissue blocks are valuable tissue resources for researchers as they are prevalent in biorepositories and often more readily available than frozen tissue. This workflow for N-glycan analysis on FFPE tissues requires two distinct spray methods for reagent application. The HTX M3+ Sprayer provides a simple platform for analyses requiring multi-method workflows. No manual switching of lines or cleaning is required due to the automation of the Cadence Pump 8-way valve and PumpScriptsTM on the HTX M3+ Sprayer. Enzyme consumption is also minimized due to the advanced fluidics control of the pump and sprayer. The data presented here illustrate the high resolution images produced from sample preparation on this instrument.
N-glycans are important indicators of physiology due to their prevalence on mammalian proteins and dynamic nature. These post- translational modifications can represent the homeostasis of cells and tissues and are therefore valuable markers of disease. The 2D-localization of MALDI images allows researchers to detect N-glycans specific to individual tissue regions such as tumors, fibrosis, and necrosis. Identification of disease-related glycan motifs paves the way for novel clinical biomarkers to detect disease.
The images and data presented here were supported or provided by Calvin Blaschke, Dr. Peggi Angel, Dr. Richard Drake, and Dr. Anand Mehta of the Medical University of South Carolina and Dr. Alyson Black of HTX Technologies, LLC.
References
(1) Powers TW, Jones EE, Betesh LR, Romano PR, Gao P, Copland JA, Mehta AS, Drake RR. (2013) Matrix assisted laser desorption ionization imaging mass spectrometry workflow for spatial profiling analysis of N-linked glycan expression in tissues. Anal. Chem. 85(20):9799-806.
(2) Drake RR, Powers TW, Norris-Caneda K, Mehta AS, and Angel PM. (2018) In Situ Imaging of N-Glycans by MALDI Imaging Mass Spectrometry of Fresh or Formalin-Fixed Paraffin-Embedded Tissue. Curr. Protoc. Protein Sci. 94 (1), e68.
(3) McDowell CT, Lu X, Mehta AS, Angel PM, and Drake RR. (2021) Applications and continued evolution of glycan imaging mass spectrometry. Mass Spec. Rev.