
Application & Background
Cellular and molecular signaling have important roles in the development and progression of cancer. However, as this communication is often dynamic and environment-dependent, it is difficult to characterize using traditional analytical techniques. A specific example of this challenge is understanding the primary metastasis of high grade serous ovarian cancer (HGSOC). It has been suggested that HGSOC first develops in the fallopian tube, and then transformed carcinogenic cells migrate to the ovary to form fallopian-tube-epithelium-derived (FTE-derived) HGSOC.
In this study, an innovative 3D cell culture was generated using agarose to allow for the diffusion of molecules within the culture. Analysis of these cultures by matrix-assisted laser desorption/ionization (MALDI) time-of-flight (TOF) mass spectrometry imaging (MSI) enabled the visualization of different chemical signals between the FTE cells and healthy ovarian explant tissue.

Figure 1. Overview of work-flow for MALDI-MSI. (A) Ovaries from 16-18 day old female mice were extracted and maintained in warm media. (B) Ovaries are separated from bursa and halved immediately prior to plating. Explants are placed in the center of half of the wells of the 8-well chamber mounted to an ITO-coated glass slide. (C) 300 μL of various cell cultures prepared in 1% agarose are plated in each well. Each cell type was plated with an ovarian explant and as a pure cell culture. (D) The entire slide was covered with a lid and incubated for 4 days at 5% CO2 and 37°C. (E) The 8-well chamber is removed. The 1% agarose 3D cell cultures maintain their shape, ensuring that the cultures do not come into contact with one another. (F) The slide is dried in a 37°C oven for 4 hours and is rotated 90° every hour, resulting in flat and secure agarose plugs for sampling. (G) Slides were sprayed with matrix using the HTX TM-Sprayer. (H) Slides were imaged using a Bruker Autoflex MALDI-TOF MS.
Experimental
Animal Handling and Sample Collection
CD-1 mice were obtained from in-house breeding. Animals were housed in a temperature and light (12L:12D) controlled environment. Water and food were provided ad libitum . All animals were treated in accordance with the National Institutes of Health Guide for the Care and use of Laboratory Animals. Day 16−18 after birth, ovaries were removed, and the explant ovaries were maintained in warm media until plating. Immediately prior to plating, the explants were separated from the bursa and halved.
Cell Culture
A total of 4 different murine cell lines were cultured, as previously described (Table 1). Cells were kept in T-75 flasks of 10 mL of αM EM media at 5% CO2 and 37°C. Cells were passaged every 3−4 days. In preparation for slide plating, cells were washed with 10 mL of PBS and collected with 1 mL of 1x trypsin in 10 mL of αM EM. Cells were counted with a hemocytometer and then centrifuged for 5 minutes at 800 rpm (Eppendorf 5810R). The α MEM media was aspirated and cells were resuspended in 2x DMEM with 10% FBS and 2x penicillin-streptomycin (Sigma D5030-10L) to a concentration of 333 cells/μL. These cells were then mixed with a volume equivalent of 2% melted agarose for a final sample concentration of 166 cells/μL in 1% agarose.

Table 1. Names and descriptions of the 4 different cell lines used in this study.
3D Cell Culture Optimization
Many factors had to be considered in the design of the 3D cell and tissue explant culture. First, it was necessary to create a culture where cellular signaling molecules were able to move, but cells were also homogenously distributed and immobile in culture. While agar is typically used for MALDI MSI of bacterial colonies, agarose was used for this culture as it kept cells in place, while allowing for the diffusion of signaling molecules. It was found that a uniform mixture of cells, media and agarose (150 μL of 1X DMEM containing 50K cells mixed with 150 μL of 2% agarose) yielded a more homogenous distribution of cells than various cell, agarose, and media layering techniques. Homogeneity in the cellular distribution ensured that observed signals were not artifacts due to cellular clustering. In addition, a uniform sample height is necessary for accurate MALDI time-of-fight (TOF) MSI anaylsis. The optimal plating condition was found to be an 8-well Permanox chamber (Lab-Tek 177445) adhered on an ITO-coated glass slide. These chambers required only 300 μL of material and the resulting agarose plugs dried flat in 4 hours.
Matrix Application Optimization
For MALDI MSI of bacterial cultures, dry matrix is typically sieved onto wet agar. However, in these experiments, it was found that sieving matrix onto the agarose plugs prior to dessication resulted in either uneven matrix coverage or ion suppression due to the quantity of matrix applied to obtain even coverage. Spraying the matrix using the TM-Sprayer onto the agarose plugs postdessication not only provided the opportunity to increase sample adherence by precoating the slide with matrix, but also resulted in a 75% reduction in crystal size, used significantly less matrix than sieving, and provided homogeneous matrix coverage while maintaining a consistent sample height for MALDI-TOF analysis (Figures 2 and 3). Prior to spraying, all matrix was recrystallized by dissolving the matrix in warm ethanol, filtering it, and adding two volumes of deionized water. The solution was left to stand overnight in a refrigerator and then the precipitate was filtered and dissolved in hot deionized water. The solution was immediately filtered through a fritted glass filter, and the crystals were collected and dried under air and then under a high vacuum.

Figure 2. (A) Samples post-incubation; (B) Samples after sieved matrix application; (C) Samples postdesiccation; (D) Samples post-incubation; (E) Samples post-desiccation; (F) Samples after sprayed matrix application.

Figure 3. (A) Images of crystals sprayed onto agarose plugs post-desiccation using the TM-Sprayer. (B) Images of crystals sieved onto agarose plugs prior to desiccation.
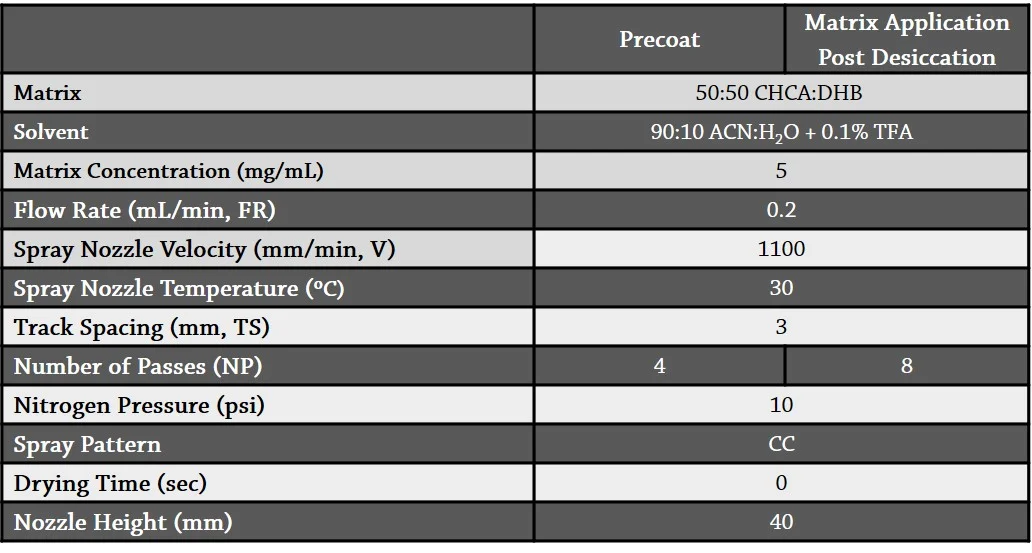
Table 2. TM-Sprayer method parameters for precoat and post-desiccation spraying.
MALDI-TOF MSI
Samples were first scanned at 1200 dpi to integrate an image for data acquisition. Then, samples were analyzed at 50 μm spatial resolution using a Bruker autoflex speed LRF mass spectrometer over m/z 100-2000 Da. The instrument was calibrated manually using phosphorus red and operated in positive mode, with laser power set to 40%, laser width set to 2 (small) and reflector gain set to 2.0x. At each sample location, 500 laser shots were fired at 2000 Hz in a random walk method. Data were analyzed using flexImaging v 4.1 x 64 and SCiLS software v2015 b was used to identify significant m/z signals at regions of interest. All spectra were normalized to the total ion count (TIC).
Results
An initial experiment was performed to determine unique signals associated with the explant/MOE PTENshRNA coculture. Four separate conditions were prepared on one slide: (1) agarose and media only (control), (2) MOE PTENshRNA cells alone, (3) an ovarian explant alone, and (4) an ovarian explant and MOE PTENshRNA cell coculture. A total of 44 m/z signals were found to be of statistical (p<0.05) and visual significance. A subsequent experiment was then performed to determine if these 44 m/z signals were unique to tumorigenic FTE-derived cells. Eight separate conditions were prepared on one slide: (1) agarose and media only (control), (2) an ovarian explant alone, (3) MOE SCRshRNA cells, (4) an ovarian and MOE SCRshRNA cell coculture, (5) MOE PTENshRNA cells, (6) an ovarian explant and MOE PTENshRNA cells coculture, (7) MOSE cells, and (8) an ovarian explant and MOSE cell coculture. The ovarian explant and MOE SCRshRNA cell coculture served as a control to determine if the observed signals were also elicited by non-tumorgenic FTE-derived cells, and the ovarian explant and MOSE cell coculture served as control to determine if the chemical signals were unique to FTE-derived cells or could also be induced by cells derived from the ovarian surface epithelium. It was found that 33 m/z signals were significantly increased (p<0.05) in the ovarian explant and MOE PTENshRNA cell coculture compared to each of the other 7 conditions (Figure 4). Among these 33 signals, m/z 170 was identified as norepinephrine, which is known to have a role in development of ovarian cancer.

Figure 4. m/z 104 and m/z 136 were two of the 33 m/z signals that were identified to be significantly higher in the ovarian explant and MOE PTENshRNA cells coculture than in any of the other 7 conditions.
However, due to the mixed coculture design of this experiment, it was unclear whether the norepinephrine was originating from the ovarian explant or MOE PTENshRNA cells. An experiment utilizing plastic tabs to divide the 8-well chamber was designed to embed the ovary separately from the cells in order to visualize the localization of the norepinephrine signal. Nine of the 33 signals identified as significant in the original experimental design were also detected here, including norepinephrine (Figure 5). It was clear from the spatial distribution of the signals that the ovary was the source of the chemical signals that then migrated through the agarose and media towards the MOE PTENshRNA cells.
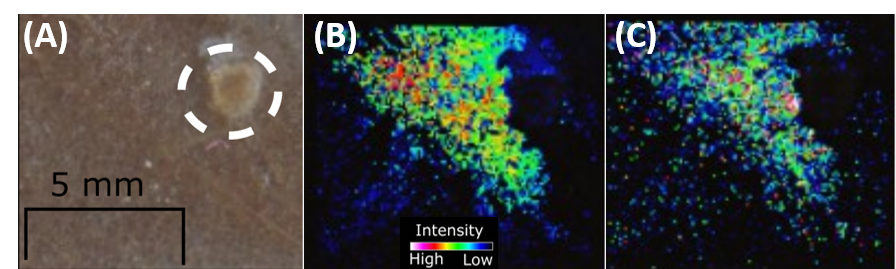
Figure 5. (A) Optical image of divided well of an 8-well chamber; (B) m/z 112 and (C) m/z 144 are two signals that were clearly originated from the ovary explant and migrated through the agarose towards the MOE PTENshRNA cells.
Conclusions
In this study, a MALDI MSI protocol was optimized for a novel 3D cell and tissue explant coculture. Specifically, norepinephrine was identified as a putative metastatic signaling molecule released by the ovary in response to tumorigenic FTE-derived cells. These data demonstrate the applicability of MSI to study tissue and cell interactions to better understand in vivo biology.
The tissue images and MS data presented here were provided by Dr. Laura Sanchez and Katherine Zink from the University of Illinois at Chicago. This work was originally presented in: Imaging Mass Spectrometry Reveals Crosstalk between the Fallopian Tube and the Ovary that Drives Primary Metastasis of Ovarian Cancer . Katherine E. Zink, Matthew Dean, Joanna E. Burdette, and Laura M. Sanchez. ACS Central Science: 2018 4 (10), 1360-1370. DOI: 10.1021/acscentsci.8b00405.