Application & Background
Matrix-assisted laser desorption/ionization (MALDI) mass spectrometry imaging (MSI) has been used to visualize the distribution of many different biochemical molecules in thin tissue slices, including N-glycans. However, there is a lot of interest in enabling this technology to be used on less-invasive sample types, including hair, fingerprints, and biofluids. In this study, a novel technique was developed to enable the MALDI MSI analysis of glycoproteins from human serum. The wide applicability of this methodology to a variety of biofluids, combined with the wealth of information gained from multiplexed antibody arrays, make this protocol a valuable asset not only for many other research groups in the MSI community, but also for clinical scientists as they look to expand their knowledge and detection of early disease states using N-glycoprotein biomarkers. An overview of this workflow is shown in Figure 1.

Figure 1. Overview of MALDI MSI workflow.
Experimental
experimental design

Table 1. Recipes for all solutions used in MALDI MSI antibody workflow.
The multiplexed antibody panels used to analyze N-glycans from immunocaptured proteins via MALDI MSI were fabricated using nitrocellulose-coated slides with an 8-well module attached (Grace Bio-Labs, Bend, OR, USA) (Figure 2) . 1.5 μL volumes of up to eight validated antibodies containing only MS-compatible ingredients were spotted into each well on the slide at a concentration of 133.3 ng/μL (Figure 2C) . The slide was then placed inside a homebuilt-humidity chamber consisting of an immunoblot incubation box with 1 paper towel and two Kim Wipes saturated with double-distilled water (~3 mL) and left to incubate overnight at 4⁰C. The next day, the slide was removed from the incubation chamber and allowed to air dry at room temperature until the antibody spots were opaque (~45 minutes), Figure 2D. Then, 500 μL of detergent wash solution (Table 1) was slowly pipetted into each well to remove any unbound proteins from the slide. The wash solution was dumped out and the slide was gently tapped against the bench to remove excess liquid. Next, 500 μL bovine serum albumin (BSA) blocking buffer (Table 1) was pipetted into each well and slide was replaced in the humidity chamber. The chamber was placed on a benchtop shaker at room temperature for 1 hour with gentle shaking in order to prevent proteins within the samples from binding nonspecifically to antibodies or the slide. Each well was then washed twice with 500 μL phosphate-buffered saline (PBS) (Table 1) for 3 minutes each time and with 500 μL of double-distilled water for 1 minute. After each wash, the wash solution was removed without any shaking.

Figure 2. (A) Diagram of 8-well modules attached to nitrocellulose-coated slides, (B) Image of 8-well modules attached to nitrocellulose-coated slides, (C) Validated antibodies spotted in 8-well modules on nitrocellulose-coated slides, (D) Dried antibody spots in 8-well modules on nitrocellulose-coated slides.
Serum Sample Preparation
Serum samples were collected following the Early Detection Research Network SOP for serum collection. They contained no preservatives and were stored at -80⁰C until use. Samples were thawed at room temperature and mixed by pipetting prior to dilution in PBS. The dilution factor varied based on the specific experiment, but typically a 1:100 or 1:1000 dilution was used. 500 μL of diluted serum samples were added to each well, and the slide was replaced in the humidity chamber. The chamber was placed on a benchtop shaker at room temperature for 2 hours with gentle shaking. Next, each well was washed with 500 μL of detergent wash solution twice for 1 minute. Each well was then washed twice with 500 μL PBS for 3 minutes each time and with 500 μL of double-distilled water for 1 minute. After each wash, the wash solution was removed without any shaking. The well module was then removed from the slide, and the slide was immersed in 50 mL double-distilled water for 1 minute to remove any residual salt and then air dried at room temperature.
Enzyme and Matrix Application using the HTX TM-Sprayer

Table 2. Spraying parameters for enzyme and matrix deposition.
Using the HTX TM-Sprayer, PNGaseF (Table 1) was applied to the slide using the parameters displayed in Table 2. As the enzyme was being sprayed, a second humidity chamber constructed from a plastic cell culture dish with 1 paper towel and two Kim Wipes saturated with double-distilled water (~3 mL) was placed in a 37°C oven for 15 minutes to preheat. After the enzyme was sprayed on the slide, the slide was removed from the HTX TM-Sprayer and placed face-up in the second humidity chamber. The chamber was left to incubate overnight in a 37°C oven. The next day, the slide was removed from the humidity chamber, and the bottom of the slide was dried using a KimWipe. Using the HTX TM-Sprayer, α- cyano-4-hydroxycinnamic acid (CHCA) matrix (Table 1) was applied to the slide using the parameters displayed in Table 2.
MALDI MSI
Prior to imaging, the slide was scanned at 1200-ppi resolution. All imaging experiments were performed on a 7.0 Tesla solariX Legacy MALDI Fourier-transform ion cyclotron resonance (FT-ICR) mass spectrometer in positive ion mode with a 2-kHz Smart Beam II laser at a laser spot size of 25 μm (Bruker Daltonics, Billerica, MA, USA). At each pixel, 200 laser shots were collected in a smartwalk pattern at a 250 μm raster.
Data Analysis
The data were collected using flexImaging v5.0 software and normalized to total ion count (Bruker Daltonics, Billerica, MA, USA). N-glycan peaks were manually selected based on their theoretical known mass values using a mass filter interval to 0.005%. Then, the data were imported into the SCiLS Lab software 2019 and quantified by measuring the area under the curve for each monoisopotic peak (Bruker Daltoniks, Bremen, Germany).
results
Optimization of FMP-10 Derivatization
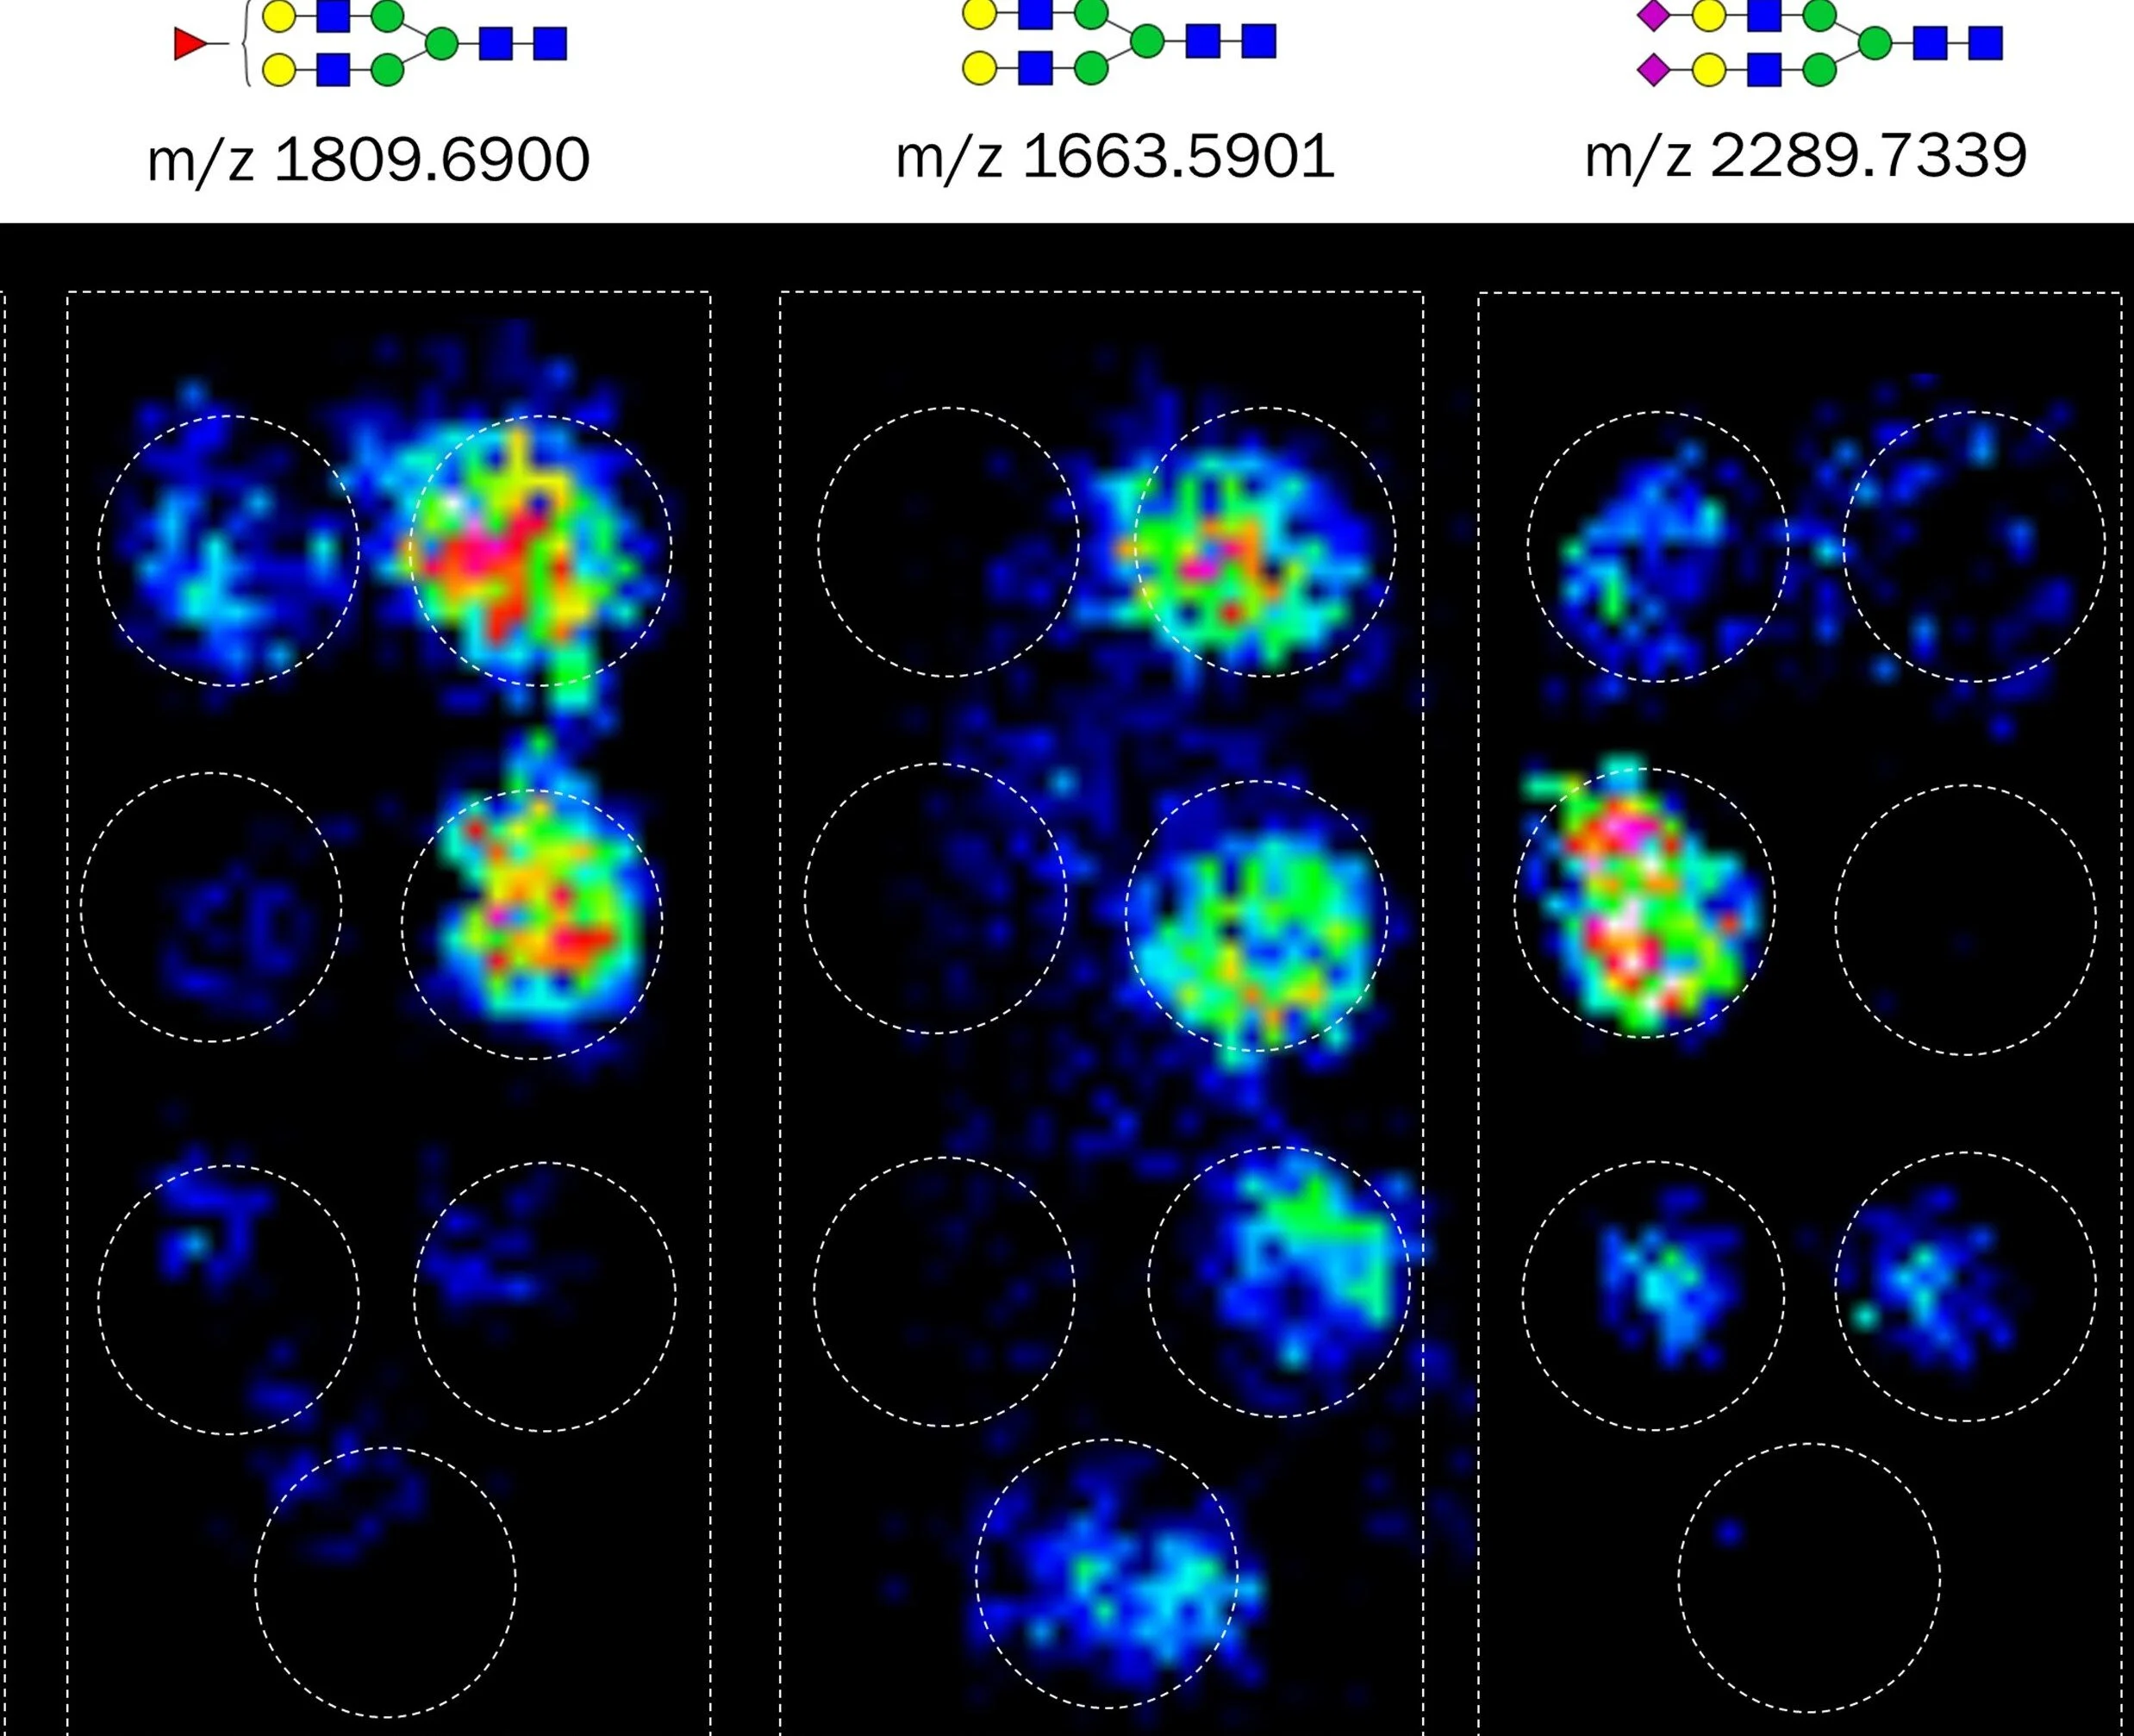
Results from this methodology are N-glycan profiles of immunocaptured proteins captured out of biofluids such as serum. N-glycan signals can be visualized as heatmaps across the slide using FlexImaging. Signals are localized to each individual capture spot as illustrated in Figure 3A, which shows representative images of N-glycans detected on simultaneously captured serum proteins. The Nglycan profiles will differ for each captured protein, with some glycans being found on many proteins while others are seen on only a few, Figure 3B. The data shown here were collected from 20 μL human serum added to antibody panels assaying 7 glycoproteins simultaneously. N-glycan intensities on each protein can then be quantified using SCiLS Lab software and compared across different sample groups such as the patient groups shown in Figure 3C. This method can be used for profiling N-glycosylation on proteins in any disease state. Analysis of 7 glycoproteins simultaneously is shown here, but this system can be expanded with larger wells for the analysis of potentially hundreds of glycoproteins.

Figure 3. (A) MALDI MSI images of 3 N-glycans localized to immuocaptured proteins. (B) Example abundant N-glycans detected for each captured glycoprotein. (C) Quantification of two N-glycan signals on two different proteins in human serum from patients with and without cancer.
Conclusions
We demonstrate the use of the HTX TM-Sprayer for N-glycan release and matrix coating on immunocaptured protein arrays. This method has been successfully used for multiplexed N-glycan profiling on serum proteins. MALDI MS analysis illustrated that N-glycans can be detected at localized capture spots with high accuracy. This methodology could be further applied to other biofluids or cell supernatants, assaying any glycoproteins for which validated antibodies exists.
The images and data presented here were provided by Alyson Black, Dr. Peggi Angel, Dr. Richard Drake, and Dr. Anand Mehta of the Medical University of South Carolina. This work was originally presented in Black, A.P., Liang, H., West, C.A., Wang, M., Herrera, H.P., Haab, B.B., Angel, P.M., Drake, R.R., and Mehta, A.S. (2019) A novel mass spectrometry platform for multiplexed N-glycoprotein biomarker discovery from patient biofluids by antibody panel based N-glycan imaging. Analytical Chemistry. 91:8429-8435.
References
(1) Black AP, Angel PM, Drake RR, and Mehta AS. Antibody panel based N-glycan imaging for N-glycoprotein biomarker discovery. Curr. Protoc. Protein Sci. 2019;98:e99.
(2) Black AP, Liang H, West CA, Wang M, Herrera HP, Haab BB, Angel PM, Drake RR, and Mehta AS. A novel mass spectrometry platform for multiplexed N-glycoprotein biomarker discovery from patient biofluids by antibody panel based N-glycan imaging. Anal. Chem. 2019;91:8429-8435.
(3) Drake RR, Powers TW, Norris-Candea K, Mehta AS, and Angel PM. In situ imaging of N-glycans by MALDI imaging mass spectrometry of fresh or formalin-fixed paraffin-embedded tissue. Curr. Protoc. Prot. Sci. 2018;94:e68.