
The images and MS data presented here were provided by Dr. Nicholas Oberlies and Dr. Vincent Sica from the University of North Carolina at Greensboro.
Application & Background
The field of pharmacognosy has been rapidly advancing to identify several novel therapeutics from a variety of natural products. However, research continues to be limited by a lack of understanding of the ecological and biological contexts of potential compounds. In this study, we set out to use an automated surface sampling system coupled to high performance liquid chromatography-high resolution mass spectrometry/mass spectrometry (HPLC-HRMS/ MS) system to investigate the molecular, spatial and temporal profiles of bioactive secondary metabolites of both a plant, Asimini triloba (paw paw), and of two species of fungi, Xylaria cubensis and Pencillium restrictum . We hypothesized that our in situ analysis method would provide novel insight into the structure and function of secondary bioactive metabolites from these species, thus presenting a high-throughput methodology to aid in the prioritization of compounds in pharmacognositc or natural products research.
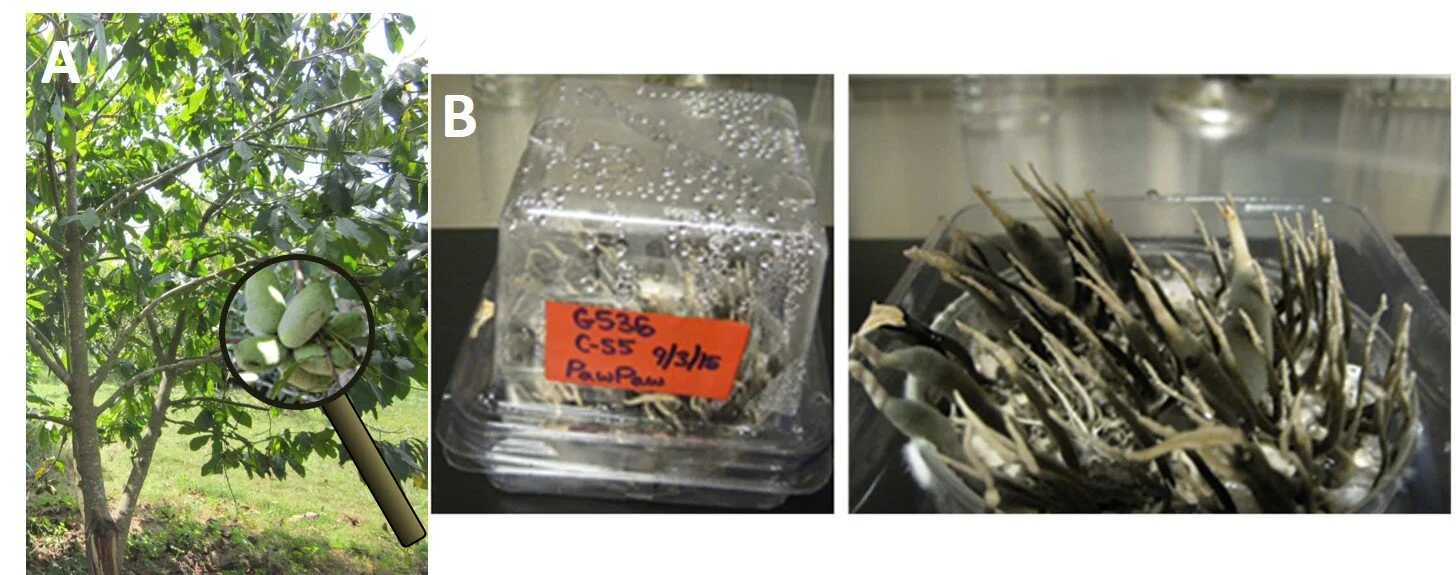
Figure 1. (A) Photograph of Asimina triloba and magnification of the fruit. (B) Images of X. cubensis (G536) grown in a glass Petri dish and placed in a sterile plant tissue-cultivating container (Plant Con®).
Experimental
Workflow for Asimini triloba
A. triloba was collected from Pfafftown, NC, USA. Seeds, pulp, and twigs were all directly sampled with the SeqQuant dropletProbe. As the leaves, petals and ovaries of A. triloba are covered with a waxy, hydrophobic surface, small (0.5 x 0.5 cm) pieces of each were immersed in Tissue-Tek optimum cutting temperature embedding medium and placed in a -80°C freezer. Once frozen, each 15 µm cross-sections of each tissue were obtained using the Leica CM1100 cryostat (Leica Biosystems Inc., Buffalo Grove, IL) and allowed to thaw on a microscope slide. Microextractions of 5 µL were performed using the SeqQuant dropletProbe with MeOH:H2O (1:1). Droplets were injected into an Acquity UPLC system (Waters Corp. Milford, MA). Data on the eluates were collected on a Qexactive Plus MS (Thermofisher, San Jose, CA). Compound Discoverer (ThermoFisher, San Jose, CA) was used to perform mass defect filtering. (± 100 Da and ± 25 mDa around m/z 603.4807).
Workflow for Xylaria cubensis and Pencillium restrictum
Fungi were isolated as endophytes from surface sterilized plant tissue segments, and cultures were maintained are UNC-Greensboro. Both strains were identified via morphological and molecular methods. After fermentation on rice media, the X. cubensis was extracted using biphasic MeOH:CHCL3 (1:1) separation method and filtered. The extracted material was separated via normal phase flash chromatography on a CombiFlashRf system using a 4 g RediSep Rf Sigel Gold column (Teledyne Isco, Lincoln, NE, USA). HPLC was performed on fraction 2. Griseofluvin eluted at 6.9 min and yielded 1.06 mg.. The structure was confirmed via NMR on a JEOL ECS-400 NMR spectrometer (400 MHz; JEOL Ltd. Tokyo, Japan) and HRMS-UPLC system. X. cubensis was transferred onto six plates of MEA and allowed to grow for 10 days. P. restrictrum was introduced, and the plates were covered and allowed to grow for 30 days when the cultures started to grow towards each other. Controls of each fungus were kept separately on PDA plates. Microextractions of 5 µL were performed using the SeqQuant dropletProbe with MeOH:H2O (1:1). Droplets were injected into an Acquity UPLC system (Waters Corp. Milford, MA). Data on the eluates were collected on a Qexactive Plus MS (Thermofisher, San Jose, CA)

Table 1. HPLC parameters for all experiments.

Table 2. MS parameters for all experiments.
results
Spatial Mapping of Annocecous Acetogenin Analogues in A. triloba
Chromatograms of Annonaceous acetogenins were prepared from the fruits (seed and pulp), twigs, leaves, and flowers (petal and ovary) of A. triloba. The in situ analysis of all of these organs by the SepQuant dropletProbe coupled to UPLC-HRMS/MS system enabled the rapid identification of acetogenins from complex mixtures through their characteristic MS/MS spectra. It was found that while the secondary metabolite profiles of each plant tissue were similar, the ovaries, a previously unstudied source of acetogenins, were discovered to contain the most extensive number of Annonaceous acetogenin analogues. In addition, the MS/MS spectra of acetogenins dervied from this methodology provide extensive structural information for these compounds through their predictable fragmentation patterns. We thus propose the use of the SepQuant dropletProbe coupled to UPLC-HRMS/MS system as an efficient method for a spatially-specific high-throughput screening of particular acetogenins of interest.

Figure 2. (A) Locations of paw paw where the droplet-LMJ-SSP directly sampled seed (black), pulp (red), and twig (green) and the portions that were cross-sectioned: ovary (blue), leaf (yellow), and petal (purple). (B) The mass defect filtered chromatograms around annonacin; 603.4807 ± 100 Da with a mass defect of ±25 mDa.
Results
Spatial Mapping of Griseofulvin Production of X. cubensis
We also conducted in situ analyses of the fungi X. cubensis and P. restrictum. These two fungi were chosen because, while the chemical structures of their secondary metabolites are well characterized, the spatial distribution of these metabolites throughout the fungal stoma is poorly understood. Through mass spectrometry mapping experiments, we demonstrated that griseofulvin biosynthesis by X. cubensis is concentrated in the younger tissue of the fungus, while polyhydroxyanthraquinones, the secondary metabolites of P. restrictum, are excreted into the surrounding environment. These results corroborate the fungistatic ability of griseofulvin. Further evidence was provided when these two fungi were grown in co-culture, as the spatial and temporal distributions of griseofulvin remained the same as the monoculture, but there was a noticeable effect on the distribution of polyhydroxyanthraquinones from P. restrictum. Specifically, the biosynthesis of two of the five polyhydroxyanthraquinones excreted by P. restrictum was dramatically reduced in the interaction zone between the two fungi. These two compounds were most active in a bacterial quorum sensing inhibition bioassay in a previous study, suggesting that X. cubensis stunts the growth of other fungi through inhibiting the production of secondary compounds, allowing it to gradually overtake the culture. We hypothesize that by inhibiting the growth of other fungi, X. cubensis ensures a symbiotic relationship with its host plant, while also gaining a competitive advantage through spreading its mycelium throughout the host.

Figure 3. The spatial distribution of griseofulvin on X. cubensis (G536) grown on MEA at (A) 2.5 weeks and (B) 5.5 weeks of growth displaying the locations of guttate and stroma formations.

Figure 4. The spatial distribution indicating the relative intensities of griseofulvin on fungal culture X. cubensis (G536) for the stroma, mycelium, and guttates at 5.5 weeks.

Figure 5. The structure of the antifungal agent, griseofulvin (1; red), from Xylaria cubensis (G536). The polyhydroxyanthraquinones (2–6) from Penicillium restrictum (G85) were grouped into two categories (purple and blue) based on their distributions in co-culture.

Figure 6. The spatial distribution of both groups of polyhydroxyanthraquinones on fungal isolates of P. restrictum at (A) 2.5 weeks and (B) 5.5 weeks. The color coding corresponds to the structures in Figure 5.

Figure 7. The spatial distribution of griseofulvin from X. cubensis (G536) while grown in co-culture with P. restrictum (G85) at (A) 2.5 weeks and (B) 3.5 weeks.

Figure 8. The spatial distribution of the (A) blue and (B) purple groups of polyhydroxyanthraquinones on fungal isolates of P. restrictum (G85) while grown in co-culture with X. cubensis (G536) at 2.5 weeks. The color coding corresponds to the structures in Figure 5.

Figure 9. The visible discoloration of P. restrictum (G85) while in co-culture with the griseofulvin-producer, X. cubensis (G536), at (A) 2.5 weeks and (B) 3.5 weeks. The discolored regions of P. restrictum (G85) are circled in red. The visible expansion of X. cubensis (G536) while in co-culture with P. restrictum (G85) at (C) 5.5 weeks and (D) 8 weeks. The guttates were attributed to X. cubensis (G536) due to the detection of griseofulvin. The stroma were attributed to X. cubensis (G536) since P. restrictum (G85) does not produce stroma.

Figure 10. Heat map of griseofulvin (red) and the P. restrictum (G85) metabolites (blue group only; purple metabolites were undetectable) at (A) 3.5 weeks and (B) 5.5 weeks. The heights of the bars are relative to their intensity from the HRMS data.
Conclusions
Through mass spectrometry mapping techniques, we were able to provide structural, spatial, temporal, and ecological functionality data on the secondary metabolites of three distinct organisms. We conclude that analysis of natural products by the SepQuant dropletProbe coupled to an HPLC-HRMS/MS system represents a methodology to efficiently generate various types of data that are critical to the discovery, prioritization, and understanding of new bioactive chemical entities.
References
Sica VP, El-Elimat T, Oberlies NH. In situ analysis of Asimina triloba (paw paw) plant tissues for acetogenins via the droplet-liquid microjunction-surface sampling probe coupled to UHPLC-PDA-HRMS/MS. Anal Methods. 2016;8(32):6143-6149.
Sica VP, Rees ER, Tchegnon E, Bardsley RH, Raja HA, Oberlies NH. Spatial and Temporal Profiling of Griseofulvin Production in Xylaria cubensis Using Mass Spectrometry Mapping. Front Microbiol. 2016 Apr 26;7:544.