
The tissue images and MS data presented here were provided by Dr. Berin Boughton and Daniel Sarabia from the School of BioSciences at University of Melbourne, Australia.
Application & Background
Soil salinization has become a serious environmental issue, leading to reductions in arable land, crop yield and disruptions to local ecosystems (1). As much as 20% of total agricultural land already contains excess concentrations of exchangeable sodium with the area affected predicted to increases to over 50% by the year 2050 (1).
As plant roots are one of the first organs to encounter and respond to environmental pressures in the soil, such as salinity stress, profiling the metabolic changes that occur in saline-stressed roots is of critical importance in order to understand the consequences of increasing soil salinity. However, plant roots are complex structures with developmental zones characterized by distinct metabolic profiles (2). Thus, it is very important to preserve the spatial information of metabolomic analysis when trying to understand the response of plant roots to external stressors (2).
In this study, we used matrix-assisted laser desorption/ionization (MALDI) mass spectrometry imaging (MSI) in order to profile the metabolic differences between control and acute salt-stressed seminal barley roots in four different root areas: (1) the root cap (RC), (2) the cell division zone, (3) the elongation zone, and (4) the maturation zone (Figure 1) (2).
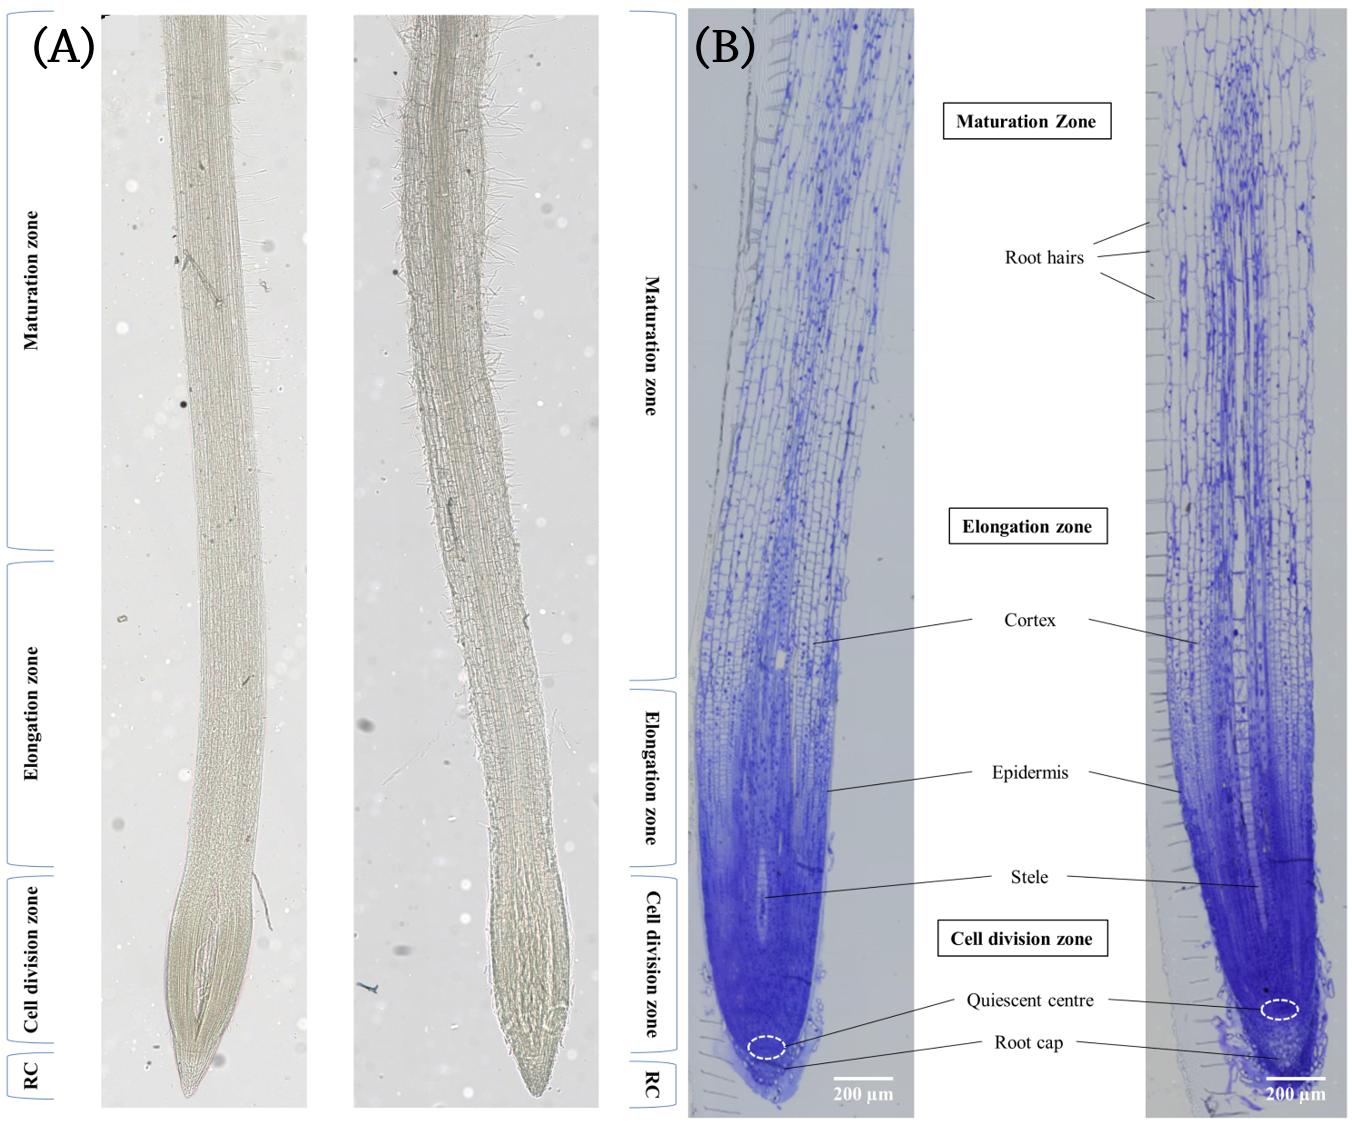
Figure 1. (A) Unstained and (B) Toluidine Blue O stained longitudinal sections of barley seminal root showing the different zones of the barley root. The left root in each image was grown in standard nutrient medium and the right root in each image was grown in nutrient medium containing 150 mM NaCl.
Experimental
Sample Preparation
Uniform barley (Hordeum vulgare L.) cv. Hindmarsh seeds were surface-sterilized and grown on agar plates at 17°C with a 24 hour dark cycle for 48 hours either in standard nutrient medium or in nutrient medium containing 150 mM NaCl. For MSI analysis, root sections were obtained measuring 15 mm long from the root tip. These sections were embedded in Super Cryo Embedding Medium (SCEM, Section Lab, Japan) and frozen in a slurry mixture of dry ice/isopropanol (Figure 2). The sections were stored at -80°C. Prior to cryosectioning, the frozen sections were placed in the cryostat at -20°C for 30 minutes. Root sections were sliced to 16 μm thickness and collected with cryofilm 2C (Section Lab, Japan) and then attached to pre-chilled glass slides with electrically-conducting carbon tape (ProSciTech, Australia). Samples were then freeze-dried under a vacuum at 1.0 mbar for 30 minutes.
Matrix Deposition
DHB was applied to the slides at a concentration of 50 mg/mL (in 100% acetone) using the HTX TM-Sprayer (Figure 2). The slides were coated using the following parameters:
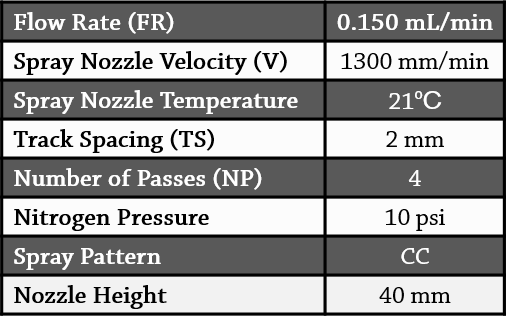
Table 1. Spray parameters for MALDI matrix deposition.
MALDI Mass Spectrometry Imaging
Imaging was performed on a Bruker SolariX 7T XR hybrid ESI-MALDI-FT-ICR-MS equipped with a SmartBeam II UV laser. The laser was set to 50% power using the minimum spot size (~10 x 15 μm). Imaging analyses were done in positive mode to collect m/z 100-1500 using 750 shots at 2 kHz, collected using a smart walk pattern grid of 25 μm with a 10% grid increment to provide a MALDI ablation spot of less than 30 μm × 30 μm. Data was acquired using FlexImaging (v4.1, Bruker Daltonics), and imaging processing and visualization were performed using SCiLS Lab (Figure 2).

Figure 2. Basic overview of MALDI MSI workflow.
Results
LIPIDOMICS
Of the 277 peaks showing spatial-specific distribution, 124 were able to be tentatively identified as lipids. The most abundant class of these annotated lipids showing spatial-specific distribution were glycerophospholipids (GPs), representing 44.9% of the annotated lipids. Within the GP class, phosphatidylcholines (PCs), phosphatidic acids (PAs), phosphatidylethanolamines (PEs) were found to be the most abundant subclasses, representing 36.8, 14, and 14% of the GP lipids, respectively. It was found that eight PC species (PC 34:1, 34:3, 36:2, 36:3, 36:4, 38:5, 38:6, 38:9) were significantly reduced in barley seminal roots in response to salt stress (4/8 PC species pictured in Figure 3).

Figure 3. Reconstructed ion images of four out of the eight PC lipid species found via MALDI-MSI to be decreased in salt stress (right) versus in control (left) samples. These findings were confirmed by LC-MS. Images were recorded with a scanning step size of 30 × 30 μm.
METABOLOMICS
In addition to the lipids identified among the MALDI peaks, 42 metabolite peaks were tentatively annotated among the ions showing spatial-specific distribution. Among these, were H+, K+ and Na+ Glycerophosphocholine (GPC) adducts, which were found to be more intensely distributed in the salt-stressed barley roots (Figure 4).

Figure 4. Reconstructed ion images of three GPC adducts found via MALDI-MSI to be decreased in salt stress (right) versus in control (left) samples. Images were recorded with a scanning step size of 30 × 30 μm. Control and salt treated images have been set to the same intensity scale and obtained from the same MALDI-MSI experiment.
Conclusions
Although MALDI-MSI is most commonly used to examine questions about human health, there is a growing interest in expanding the use of technology into fields such as environmental science, food science, and botany. Here, we have demonstrated the utility of MALDI-MSI in a study of plant metabolomics to examine molecular changes in seminal barley roots in response to salinity stress (2). Interestingly, we found that many PC species were significantly decreased in response to salinity stress (2). As PCs are a prominent component of many eukaryotes' outer membranes, these reductions of PC species in salt-stressed roots may indicate changes in membrane fluidity and permeability (3). In contrast, it was found that GPCs were increased in salt-stressed roots, particularly in the elongation and cell division zones (2). It has been previously suggested that GPCs play a role in plants response to salinity stress (4). Developing robust and reproducible imaging protocols, such as the one detailed here, will be an important part of expanding the use of MALDI-IMS in environmental and plant science.
References
(1) Shrivastava, P. and Kumar, R. (2015). "Soil salinity: A serious environmental issue and plant growth promoting bacteria as one of the tools for its alleviation" Saudi Journal of Biological Sciences (22)2, 123-131.
(2) Sarabia, L. D.; Boughton, B. A.; Rupasinghe, T.; van de Meene, A. M. L.; Callahan, D. L.; Hill, C. B.; Roessner, U. (2018) "High-mass-resolution MALDI mass spectrometry imaging reveals detailed spatial distribution of metabolites and lipids in roots of barely seedlings in response to salinity stress." Metabolomics 63(14), 62-16.
(3) Upchurch, R. G. (2008). Fatty acid unsaturation, mobilization, and regulation in the response of plants to stress. Biotechnology Letters, 30(6), 967–977.
(4) Aubert, S., Gout, E., Bligny, R., Marty-Mazars, D., Barrieu, F., Alabouvette, J., et al. (1996). Ultrastructural and biochemical characterization of autophagy in higher plant cells subjected to carbon deprivation: Control by the supply of mitochondria with respiratory substrates. The Journal of Cell Biology, 133(6), 1251–1263.