
Application & Background
Matrix-assisted laser desorption/ionization mass spectrometry imaging (MALDI MSI) is an analytical technique that allows for the correlation of biochemical data with pathological features. While MALDI MSI is already used in some clinical settings, the large amount of time needed to acquire data often precludes the use of this technique in time-sensitive clinical atmospheres, such as the operating theatre, and in clinical trials with large sample sizes. The issue is further exacerbated by the inverse relationship between MALDI MSI spatial resolution and the time needed to acquire data (Figure 1). In this study, we sought to explore the capability of the uMALDI prototype source combined with the Waters Research Enabled Software (WREnS) to produce high-resolution MALDI MSI images in less time.

Figure 1. Graphic illustration of the increased time needed to acquire MALDI ion images with lower spatial resolution.
Experimental
Sample collection
Rodent brain tissue samples were extracted from healthy Wistar Han rats and mice by the group of General Surgery, Maastricht University Medical Center via the an organ extraction protocol in compliance with the Dutch Animal Experimental Act. The protocol was approved by the Animal Experimental Committee of Maastricht University Medical Center. In accordance with the 'good use of redundant tissue for clinical research' guideline issued by the Dutch Federation of Medical Research Societies, articular cartilage was collected from knee joints of patients as they underwent arthroplasty. 5mm discs of osteoarthritic cartilage were cut out from the collected tissue using a sterile biopsy punch.
Sample preparation
Rodent brain tissues were Using a Leica CM3050S cryostat (Leica Biosystems), 20 µm tissue sections were cut at -20ºC and individually mounted onto glass microscope slides (Fisherbrand®, Superfrost Plus). The cartilage discs were washed several times with PBS 1% penicillin/streptomycin and ice-cold ammonium acetate buffer (150 mM, pH 7.3) and then snap-frozen in liquid nitrogen. The discs were stored at -80ºC until they were cryo-sectioned at 12 µm thickness at -20ºC using a Leica cryostat. The rodent brain samples were cryo-sectioned at 10 µm thickness at -20ºC using a Leica cryostat. All samples were then thaw-mounted onto regular non-conductive glass slides and stored at -80ºC until MALDI MSI analysis.
Matrix Application using the HTX TM Sprayer
Tissue sections were dried at room temperature under a gentle flow of nitrogen gas for 30 seconds. For the rat brain and cartilage tissue sections, norharmane was applied to the slides at a concentration (C) of 7 mg/mL (in CHCL3:MeOH, 2:1, v:v) using the HTX TM-Sprayer. The slides were coated using the following parameters listed in Table 1. For the mouse brain tissue sections, CHCA was applied to the slides at a concentration (C) of 5 mg/mL (in acetonitrile:water, 70:30, v:v) using the HTX TM-Sprayer. The slides were coated using the following parameters listed in Table 2.


Table 1. Spraying parameters for norharmane matrix deposition using the HTX TM Sprayer.

Table 2. Spraying parameters for CHCA matrix deposition using the HTX TM Sprayer.
MALDI MSI
Imaging was performed on two MALDI SYNAPT High Definition mass spectrometer (HDMS) G2-Si systems (Waters Corporation, Manchester, U.K.). Both systems were tuned to conduct MALDI-MSI experiments and fitted with a 2.5 kHz, Nd:YAG laser (λ = 355 nm, laser energy = 25 nJ). One system had a first generation Waters MALDI source, and the second system had a prototype "uMALDI" source. The uMALDI source consists of an x-y stage with 1 mm pitch lead screws, an ion guide, and extraction electrode assembly. Samples are loaded and unloaded through a door. The uMALDI beam path is adjusted using two dielectric mirrors and passes through a variable transmission neutral density wheel and fused silica 75 mm focal length best form lens before being directed onto the MALDI sample plate. The lens is mounted on a linear translation stage, allowing the diameter of the beam incident of the sample plate to be varied from 15-150 µm. An additional neutral density filter can be inserted into the beam path to further attenuate the laser intensity when operating with the laser beam tightly focused on the sample. The samples were optically scanned using a flatbed scanner to produce a digital image for future reference. This image was then imported into the MALDI imaging pattern creator software (High Definition Imaging (HDI) v1.4 software, Waters) to define the region to be imaged. Acquisitions were performed on both instruments in “sensitive MS mode” using positive or negative ionization modes for lipid detection. Instrument calibration was performed in both positive and negative ion mode using a standard calibration mixture of red phosphorous.
The rat brain tissue sections were imaged over the mass range m/z 200-1000 at 2.5 and 4 pixels /second, corresponding to 45 x 45 µm2 and 15 x 15 µm2 spatial resolution, respectively. The optimized laser pule energy was 240 arbitrary units (a.u.) for imaging at 2.5 pixels/second and 310 a.u. for imaging at 4 pixels/second. The laser frequency was 1000 Hz.
Half mouse brain tissue sections were imaged over the mass range m/z 400-1000 with a fixed quadrupole profile at m/z 500 to avoid matrix peaks in the mass range. The optimized laser pulse energy was 240 a.u. and the laser repetition rate was 1000 Hz. The cartilage tissue sections were imaged over m/z 400-1000 with a fixed quadrupole profile at m/z 300 to get a signal from the tissue. The analysis was performed at a speed of 20 pixels/second with a laser repetition rate of 1000 Hz.

Figure 2. (A) General MSI workflow incorporating sample handling and preparation; (B) Acquisition of half of a rat brain on either the first generation source of the Synapt G2-Si or the uMALDI using discrete or continuing raster mode leading to big variance in term of acquisition time from 3.5 h to 40 h; (C) The data processing takes 30 min and allows spatial visualization of compounds of interest;(D) According to the chosen workflow, the overall analytical time can vary between 4.5 h to 41 h.
results
WREnS Allows for Continuous Raster Imaging
A new software platform allows for continuous movement of the sample carrier plate while maintaining pixel synchronization. Scan speeds were tested between 5 to 40 scans per second in both "typewriter" and "serpentine" patterns (1 pixel = 1 scan). It was found that spectrum quality was maintained at higher scan speeds, although there was some loss of signal intensity at higher scan rates (Figure 3). In addition, it was found that scanning in a sepertine maintained image and data quality while decreasing acquisition time by 8%.
High-Speed and High Resolution Imaging of OA Tissue at the Cellular Level
Chrondrocytes are the only cell type present in cartilage, and they are sparsely distributed. The uMALDI source allowed for the lipid distribution of human OA cartilage to be visualized for the first time (Figure 4). Advances such as the uMALDI source that allow for faster imaging, while maintaining high resolution are of critical importance as scientists move MALDI MSI closer to clinical applications.

Figure 3. Spectra acquired on the uMALDI source using different scan speeds.
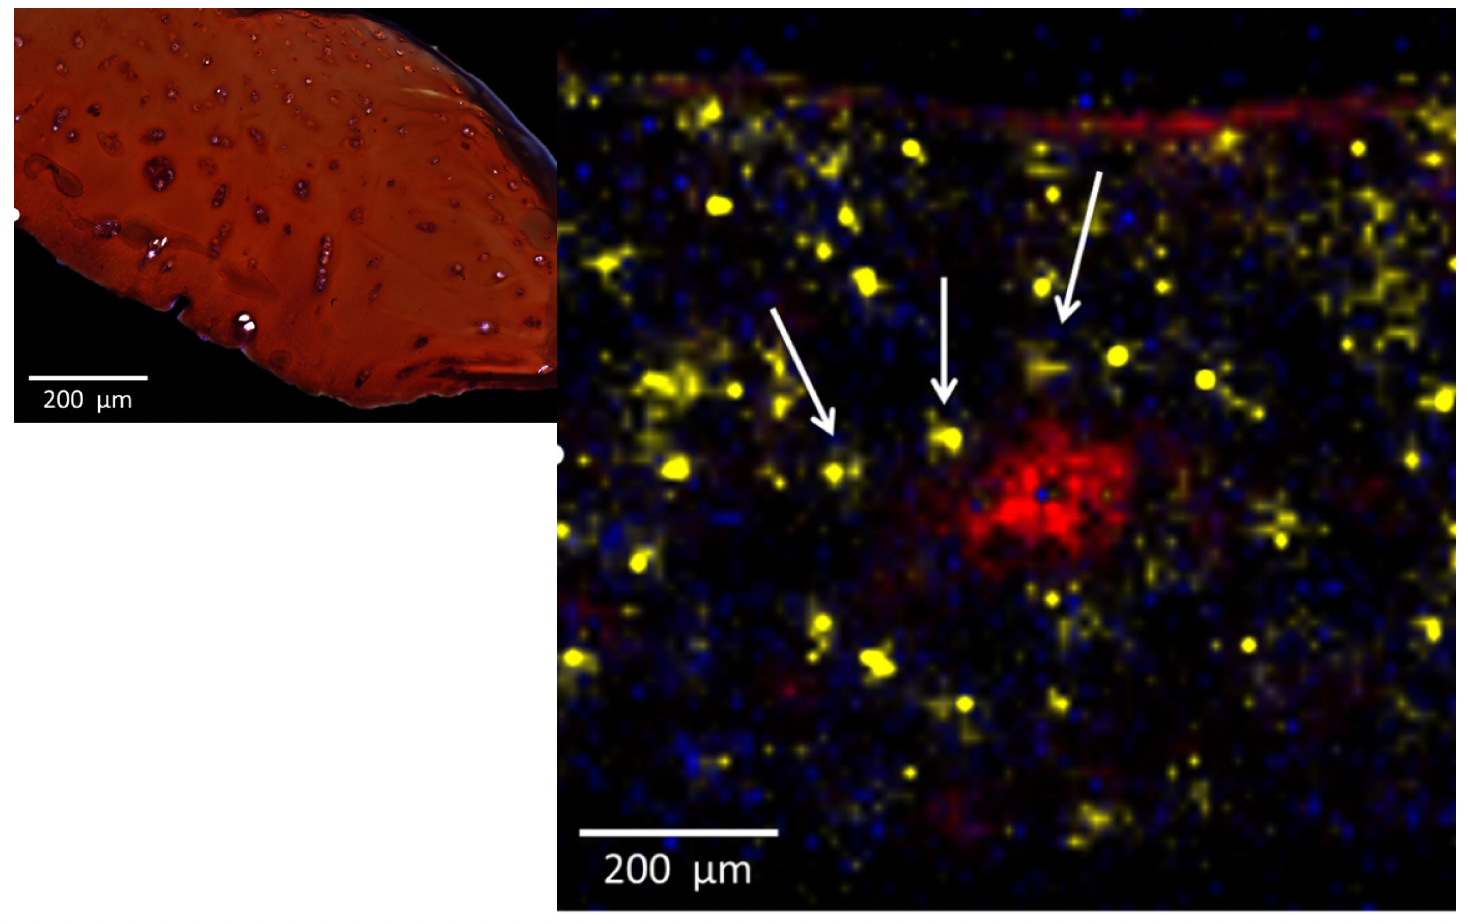
Figure 4. High spatial resolution MALDI-MSI of cartilage tissue. (A) OA cartilage stained with o-safranin, fast green, and hematoxylin. (B) MALDI image obtained at 15 µm spatial resolution using the uMALDI coupled to WReNS (20 pixels per second). SM (d18:1 16:0) [M+H]+ (m/z 703.57, red color) was expressed in the damaged superficial part of the tissue, PC (18:0 18:1) [M+Na]+ (m/z 810.60, yellow color) was specifically expressed for chondrocytes while DMPE (34:1) [M+H]+ (m/z 746.57, blue color) was mostly found in the matrix of the tissue. Arrows are pointing out the chondrocyte pellets.
improved Image Resolution and Signal Intensity using the uMALDI Source in Discrete Mode
It was found that using the new uMALDI source, the laser could be tuned to an effective spot size of 15 µm, as opposed to the previous minimum spot size 45 µm available on the first generation MALDI SYNAPT HDMS G2-Si source. In addition, a higher intensity and signal-to-noise ratio for lipid species were observed in the single pixel spectra obtained by using the uMALDI source (Figure 5). This is likely due to the faster and more precise motion of the stage of the uMALDI source when compared to the first generation Waters MALDI source, that prevents any oversampling during acquisition.
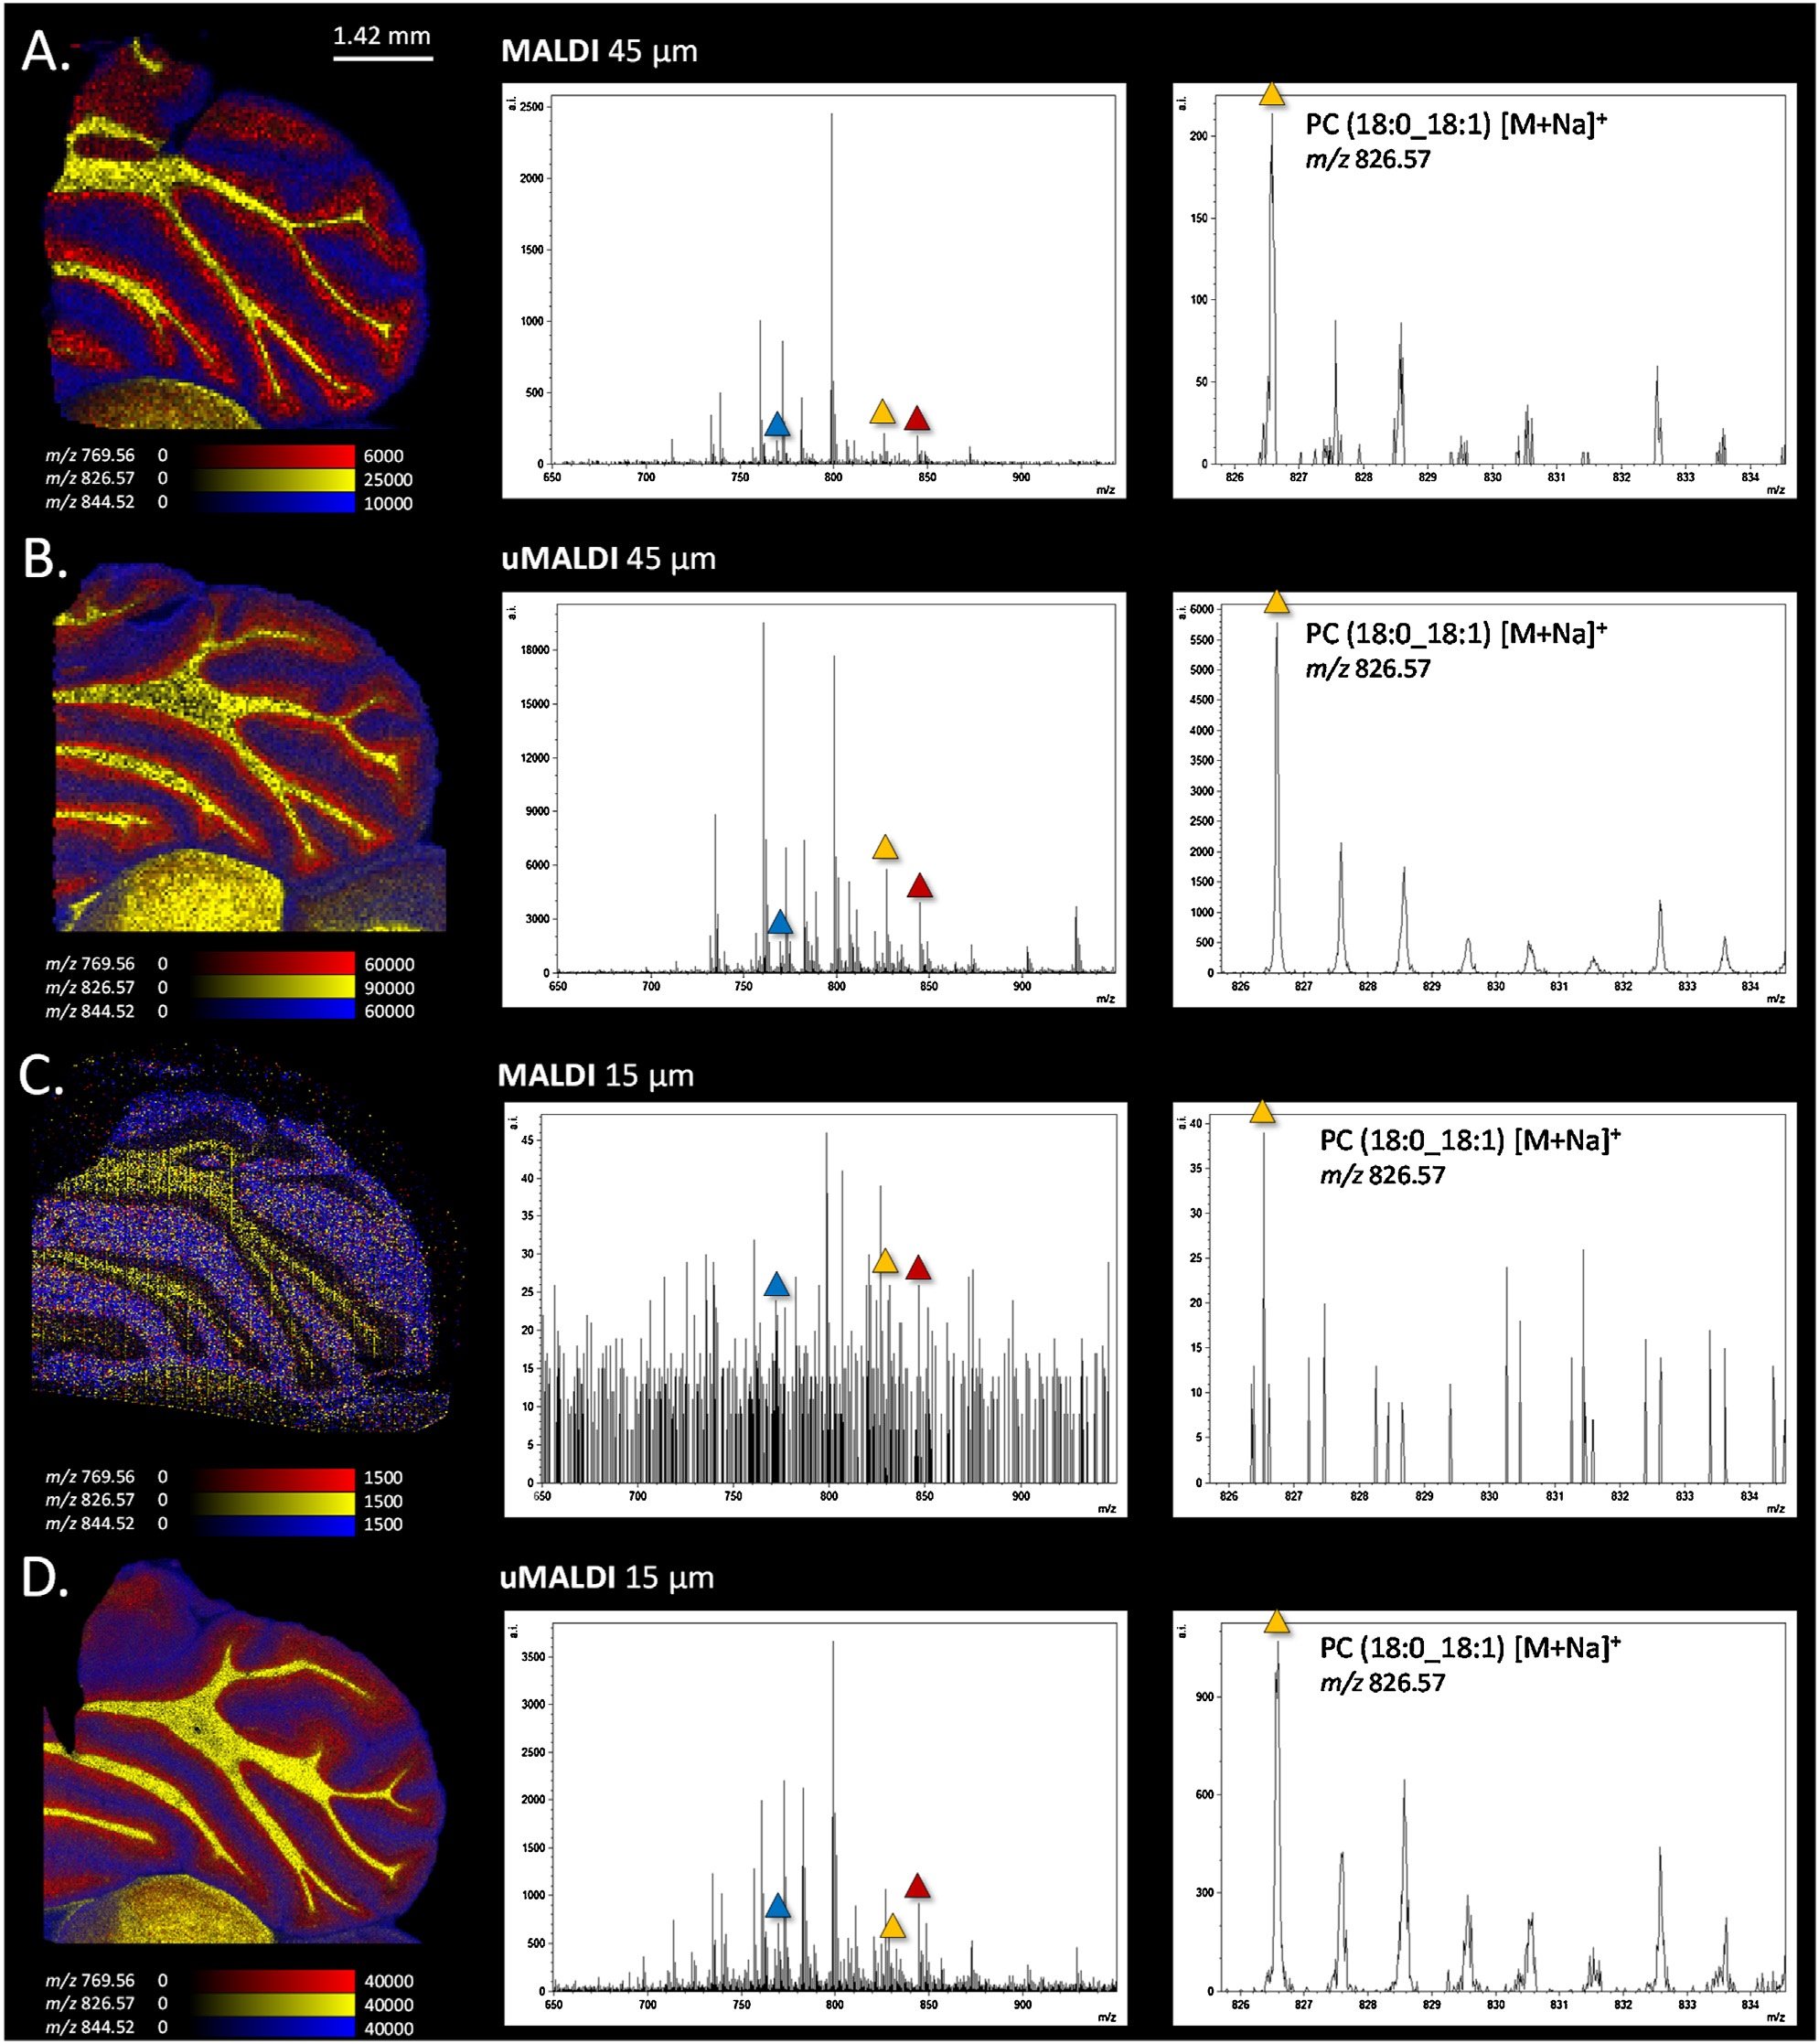
Figure 5. Comparison between the first generation source and the uMALDI source coupled to a SYNAPT HDMS G2-Si system for lipids imaging in positive mode on rat cerebellum (spot-mode). (A) MALDI experiment on rat cerebellum performed at 45 µm spatial resolution using the 1st generation source. (B) MALDI image acquired using the new designed uMALDI source with a defocus laser to perform experiment at 45 µm spatial resolution. (C) Image and spectrum obtained after use of the 1st generation source at 15 µm spatial resolution. (D) uMALDI image at 15 µm using a focus laser and spectrum extracted from the data.
All data and images were originally published in: F. Barré, et al., Faster raster matrix-assisted laser desorption/ionization mass spectrometry imaging of lipids at high lateral resolution, Int. J. Mass Spectrom. (2018), https://doi.org/10.1016/j.ijms.2018.09.015..